
The best gamer always emerges victorious from a duel, racking up his win streak. However, being this conspicuous – who doesn’t want to take him down?
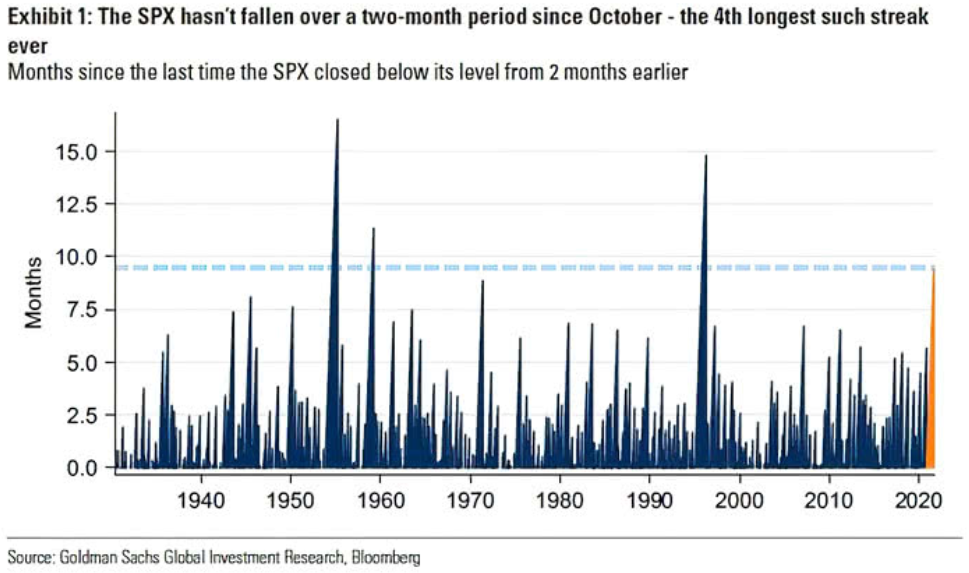
The same is the case with the S&P 500, which hasn’t recorded a two-month decline in nearly 10 months. It’s the fourth-longest streak on record! What’s more, the general stock market suffered another bout of volatility recently — with everyone teamed up to take the index lower, the only remaining question is: When?
Fuel To The Fire
With Jerome Powell, chairman of the U.S. Federal Reserve, speaking at the annual Jackson Hole Economic Symposium on Aug. 27, the Delta variant has clearly paved a dovish pathway. However, could the magician actually reveal his secret? Well, as a not-so-subtle hint of what’s to come (whether today or over the next few months), Fed hawks were out in full force on Aug. 26. Speaking with CNBC, Dallas Fed President Robert Kaplan said that “what we’re seeing in these [lower-income] communities is inflation affects them disproportionately. I think at the Fed we have to take that very seriously.”
And what does this mean for his taper timeline?
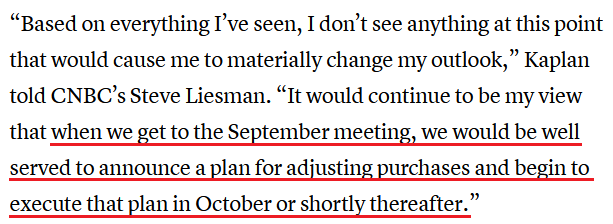
Source: CNBC
Likewise, Kansas City Fed President Esther George also told CNBC on Aug. 26 that “I would be ready to talk about taper sooner rather than later.”
“When you look at the job gains we saw last month, the month before, you look at the level of inflation right now, I think it would suggest that the level of accommodation we’re providing right now is probably not needed in this scenario.”
Even more hawkish, she actually downplayed the economic impact of the Delta variant:
“Both the anecdotes I hear from our contacts in the region and the data so far do not show a material change in the outlook.”
Upping the ante, St. Louis Fed President James Bullard led the hawkish brigade on Aug. 26. Also, speaking with CNBC, Bullard said that “we do have a new framework we did say that we would allow inflation to run above target for some time, but not this much above target.”
“I think that there is worry that we’re doing more damage than helping with the asset purchases because there is an incipient housing bubble in the U.S. The median house price, at least the number I saw, was approaching $400,000,” he said. “We got into a lot of trouble in the mid-2000s by being too complacent about housing prices, so I think we want to be very careful on that this time around.”
And not only does Bullard want the taper to begin immediately, but he’s advocating for net-zero asset purchases by the end of Q1 2022.
Please see below:
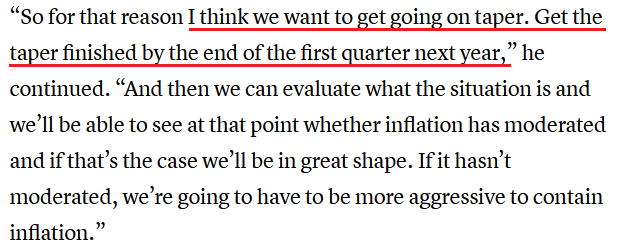
Source: CNBC
S&P 500 – A Correction Coming?
Furthermore, as the taper drama unfolded on Aug. 26, equity investors responded with expected disdain and the negativity ushered the USD Index back above 93. More importantly, though, with the gold price exhibiting strong negative correlations with the U.S. dollar, a profound correction of the S&P 500 could capsize precious metals. To explain, while the general stock market suffered another bout of volatility, the S&P 500 hasn’t recorded a two-month decline in nearly 10 months. For context, it’s the fourth-longest streak on record.
Please see below:
Moreover, the Institute for Supply Management’s (ISM) manufacturing PMI is highly correlated with the S&P 500. And with the former falling from its recent high and poised to turn lower in the coming months, the S&P 500 may find itself running out of upside catalysts.
Please see below:
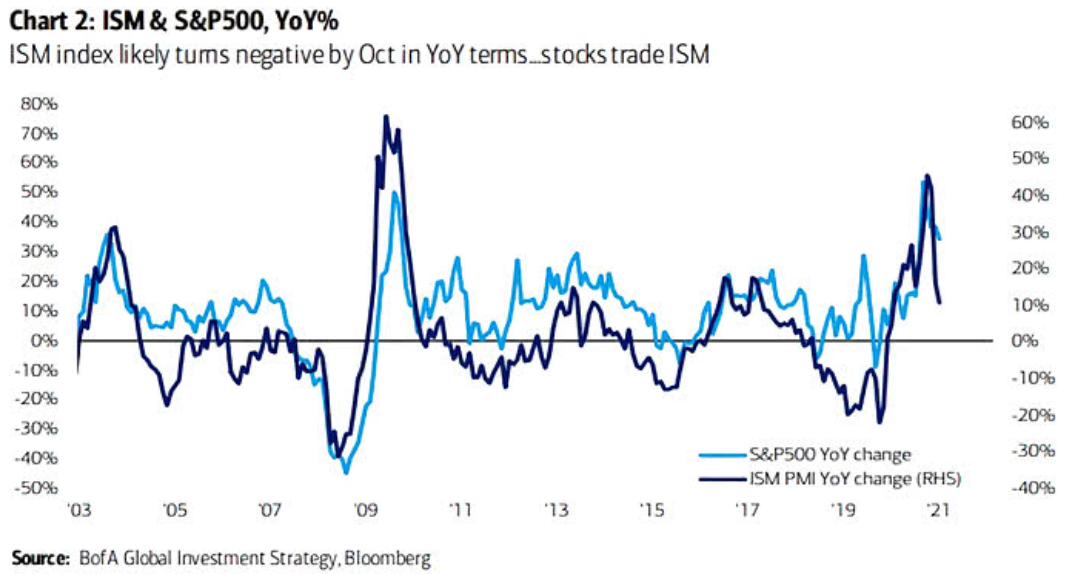
To explain, the dark blue line above tracks the year-over-year (YoY) percentage change in the ISM’s manufacturing PMI, while the light blue line above tracks the YoY percentage change in the S&P 500. If you analyze the right side of the chart, you can see that the former’s decline has already outpaced the latter’s. And with Bank of America predicting that the ISM’s manufacturing PMI (in YoY terms) will turn negative by October, the S&P 500 may follow in its footsteps.
Adding to Wall Street’s trepidation, Morgan Stanley also expects a profound correction. Chief equity strategist Michael Wilson told clients on Aug. 20 that unprecedented fiscal spending fuelled “a hotter but shorter cycle” and that a reversion to the mean could hammer the S&P 500 in the coming months.
He wrote:
“With Congress expeditiously providing record amounts of fiscal stimulus last year, the table was set for a major consumer stand against the downturn. Fast forward 16 months and it's fair to say the U.S. consumer has not disappointed. But, after a year of remarkable resilience from the U.S. consumer, it begs the question: ‘Is it sustainable?’ While there is little doubt about the U.S. consumers' willingness to spend, the other key variable to consider is their ability to spend.”
Please see below:
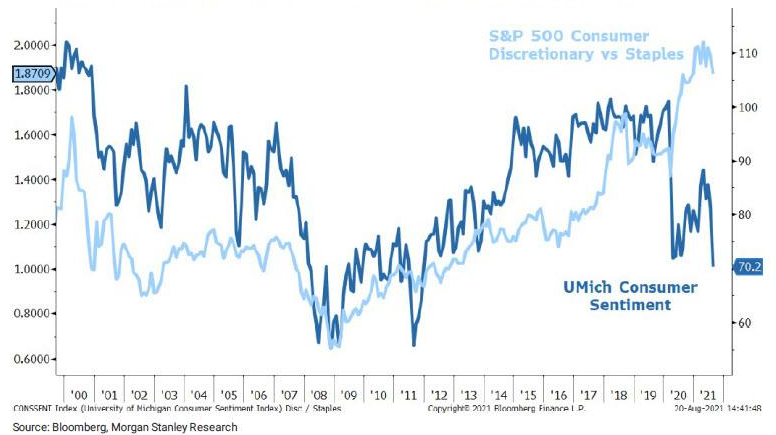
To explain, the dark blue line above tracks the University of Michigan’s Consumer Sentiment Index (CSI), while the light blue line above tracks the S&P 500’s consumer discretionary/consumer staples ratio. When the light blue line is rising, it means that consumer discretionary companies (cyclicals) are outperforming staples (risk on). Conversely, when the light blue line is falling, it means that consumer staples companies (defensives) are outperforming consumer discretionary (risk off). If you analyze the right side of the chart, you can see that the light blue line has already rolled over. And with the dark blue line now at a 2021 low, the ratio has plenty of catching up to do. Moreover, with the cyclical basket home to some of the S&P 500’s most expensive stocks outside of the technology sector, an unwinding of the excess could have a profound impact on the USD Index, and therefore, the performance of the PMs.
As further evidence, with investors throwing caution to the wind, the S&P 500 is running low on capital.
Please see below:
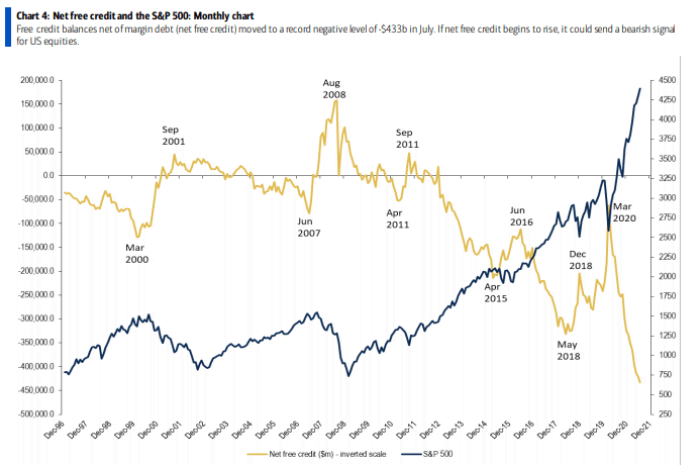
Source: Bank of America (NYSE:BAC)
To explain, the dark blue line above tracks the S&P 500, while the gold line above tracks the net free credit balances held in investors’ cash and margin accounts (data from FINRA). In a nutshell: it’s the amount of purchasing power (cash and debt) that investors can use to buy more stocks. If you analyze the relationship, you can see that historical lows in investors’ net free credit balances often coincide with historical peaks in the S&P 500. More importantly, though, if you analyze the right side of the chart, you can see that investors’ net free credit balances are easily at an all-time low. As a result, with the bulls all in and little dry powder available to accelerate the momentum, the S&P 500’s pain could turn into the USD Index’s gain.
Volatile Times Ahead
Finally, with the Cboe Volatility Index (VIX) – which measures the expected volatility in the S&P 500 over the next 30 days – surging by more than 12% on Aug. 26, seasonal signals imply that uncertainty could reign supreme over the next few months.
Please see below:
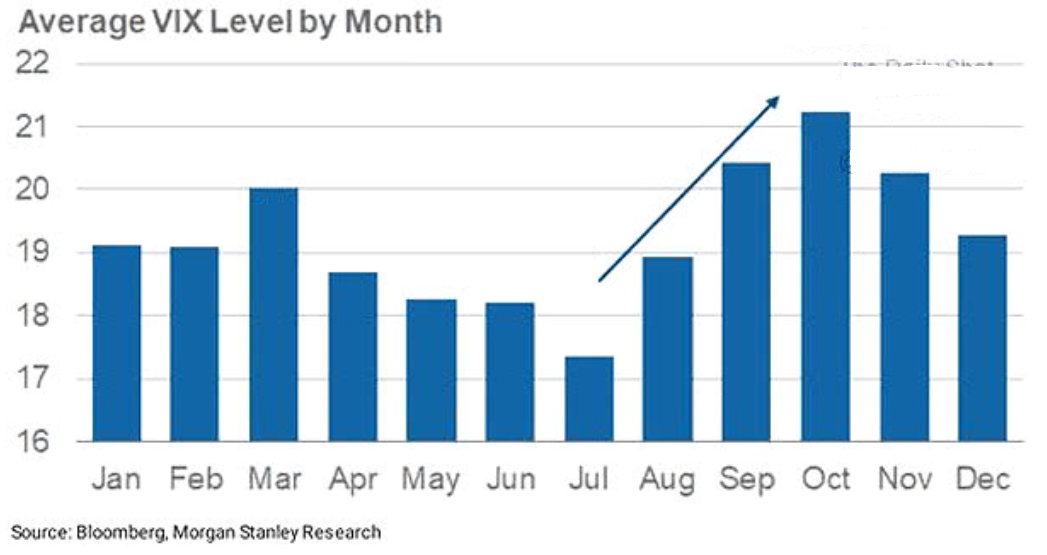
To explain, the blue bars above track the average value for the VIX during each month of the year. If you analyze the arrow in the middle, you can see that VIX spikes often occur in August, September and October. And with this year’s edition coinciding with the Fed’s taper timeline and investors’ all-time high exposure to stocks, the U.S. dollar could be in high demand if (when) volatility erupts.
In conclusion, the precious metals suffered another pullback on Aug. 26 and their medium-term downtrends remain intact. And while Powell’s presser may result in ‘precious metals up, USD Index down,’ the short-term sugars highs often have very short shelf lives. Moreover, with the Fed’s taper timeline poised to reach its climax in the coming months and the uproar likely to upend the S&P 500, the USD Index’s medium-term fundamentals remain robust. As a result, the precious metals are unlikely to find a true bottom until these developments subside.