Get 40% Off
⚠ Earnings Alert! Which stocks are poised to surge?
See the stocks on our ProPicks radar. These strategies gained 19.7% year-to-date.
Unlock full list

S&P 500: Is It The 1970s All Over Again?

Published 09/09/2020, 04:55 PM
Updated 07/09/2023, 06:31 AM

One of the underlying basics of the Elliott Wave Principle (EWP) is that the financial markets are self-similar at different degrees of trends, aka, waves. It is called “fractal.” Thus, patterns keep repeating themselves, but not exactly. That would be too easy. Markets function more along the lines of Mark Twain's “history never repeats itself, but often rhymes.” Thus, it can be helpful to see if the current price action resembles that of the past to allow us to get an idea of what is likely next for the markets.

Several weeks ago, I informed my Premium Major Market Members that the S&P 500, since its low on the day of the U.S. presidential election in 2016 until now, strongly resembles the price pattern during the 1960s through early 1970s. See figure 1 below. I placed the “you are here” annotation back then. Several weeks later, and it is time to share my observations here.

In Figure 1: S&P 500 comparison between now and the 1960-1970s timeframe.
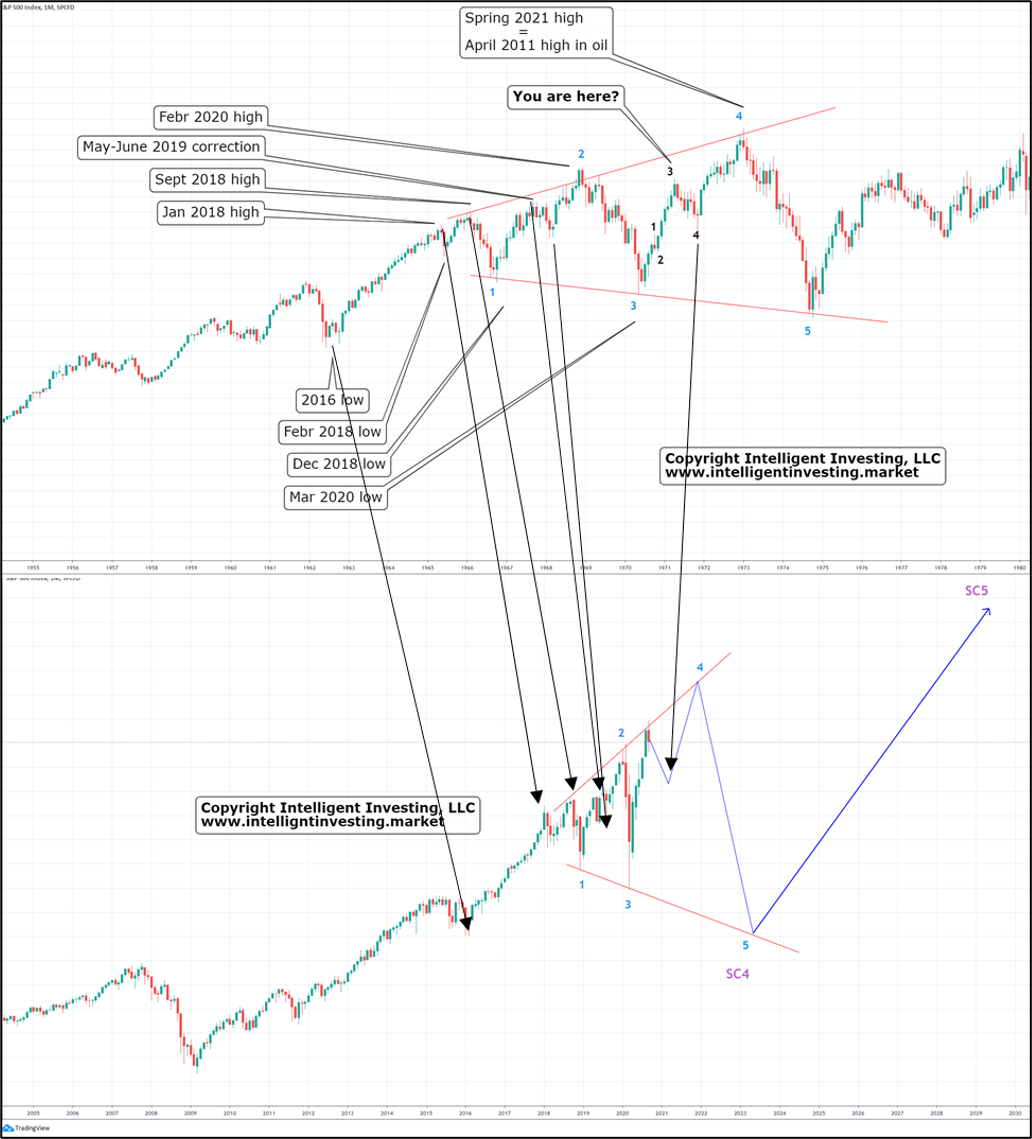
S&P 500 Comparisons: Now And 1960-1970s.

As you can see, the resemblances in price pattern/EWP waves are remarkable. The black arrows show the alignment of some of the smaller similarities, while the blue numbers show the important highs and lows then and now. Noteworthy is that the current market is apparently moving much faster than back in the '60s and '70s. Why that is, precisely, is unclear. But the why does not matter. The fact the fractal has been in place since 2016 is what matters.

Currently, the S&P 500 is correcting after its monster rally off the March 2020 low. This also happened in 1971. (Blue numbers 3.) Back then, after several months of correcting, the index went for the last bull run to blue 4 in late-1972 before erasing all gains by mid-1974 (blue 5). From then on, the S&P 500 went into a multi-decade bull. Thus, if the current fractal continues, and there is as yet no indication it will not, then the blue path for the current years can be expected to be taken: a multi-week correction followed by a rally into spring 2021 before all gains are erased: blue 4, 5.

This pattern matches with the average U.S. presidential election year patterns (see Figure 2 below). That pattern has, on average, a top in early-September, bottom mid- to late October, and then a rally. The S&P 500 topped Sept. 2. So far, so good.

Figure 2: Average U.S. Presidential Election Year Patterns [1, 2]
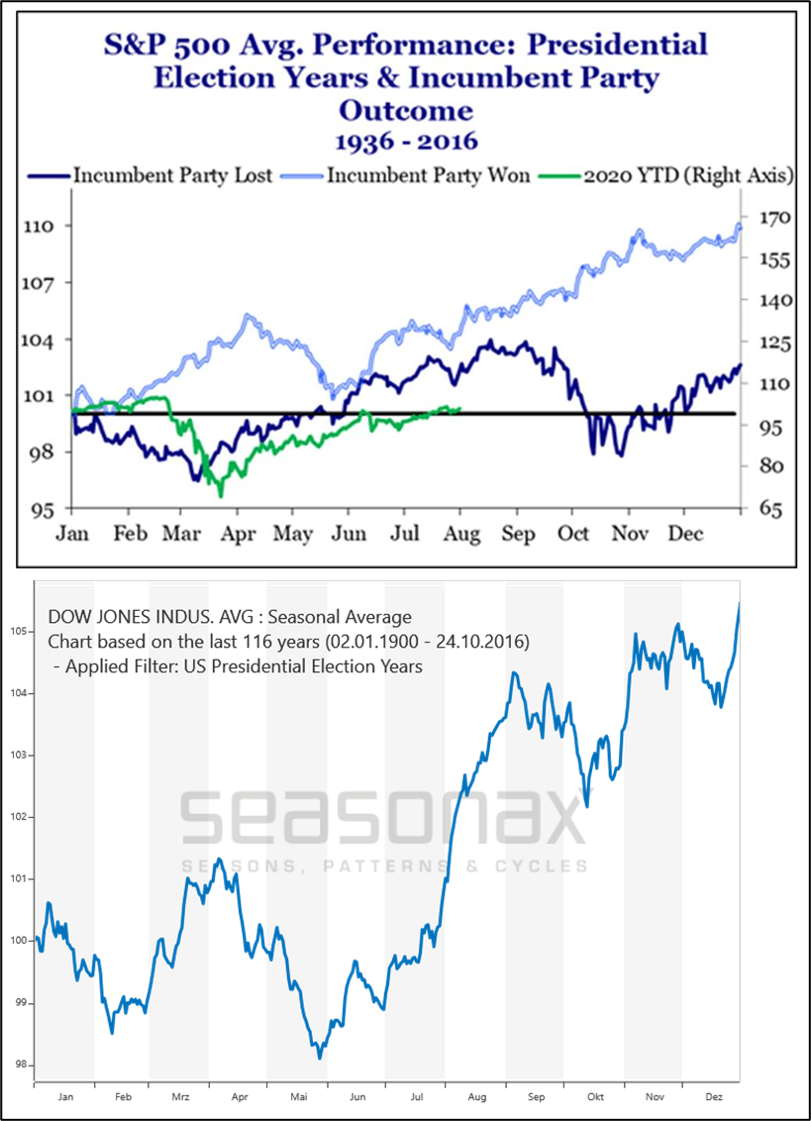
Figure 2.

And the pattern is also matched with the fact crude oil appears to have a 10-year lead on the Dow Jones, which means that the Elliott waves seen in crude oil show up approximately 10 years later in the stock market [3]. McClellan points out this Oil-Dow Jones relationship has been working very well for more than 120 years, and that is for me long enough; it should be respected, continuously monitored for, and its imperfections accepted.

When you read McClellan’s post (hyperlink to post below), you will find crude oil prices peaked in April 2011, and then started a long ugly downtrend into February 2016 [3]. Thus, if the market is going to continue following oil’s previous path – and there is currently nothing to tell us it will not – then that should mean the top for stocks is due around April 2021, and there should be a bear market crash for stocks in 2024 [3].

Bottom Line: There is a fractal development in the S&P 500 between now and the 1960s-1970s. If the fractal continues to play out, it forecasts a correction for several weeks, a multi-month rally and then a severe multi-year bear market that erases all gains since the recent March 2020 low. The more current price action is supported by the average U.S. presidential election year pattern, and the outcome of the larger fractal is supported by the Oil-Dow Jones relationship discovered by Mr. McClellan [3]. Hence, there are several lines of evidence supporting the 1960-1970 path going forward. For me, that is good enough to pay attention to it over the coming weeks and months, and I will continue to update my premium major market members about its progress. I suggest you do the same.

References

[1] https://www.strategasrp.com/

[2] https://www.seasonalcharts.com/zyklen_wahl_dowjones_election.html

[3] https://www.mcoscillator.com/learning_center/weekly_chart/crude_oil_10-year_lead_update/

Latest comments

Hi Dr. Arnout, is it still intact? Do you have a followup article on this please?
Thanks for sharing! Where can I find a bigger picture of s&p500 EWA?
Did they also print 6 trillion dollars, have 0% fed funds rate, and a global pandemic in the 1960's and 1970's?  Technical analysis using historical charts that magically line up may not be the best approach here.
Dr. Arnout, I am becoming a firm believer in your predictions with your fantastic Tesla forecasts. I forecast traffic for a living and I too believe in application of existing or/and past patterns to future. So, if I read correctly, S&P will dip further to around 3150 before going up, if DT gets elected. Is that a correct understanding?
Thank you! If markets rally into election: 80% chance incumbent president gets elected. if they drop into elections it is vice versa
Greatly appreciated your sharing
thank you!
Dr. Arnout, this is a good analysis, thanks for sharing. You pointed out the quote from Mark Twain's: “history never repeats itself, but often rhymes.” as well as the fact that "this market looks moving much faster". I did place a similar analysis into context looking at past trends to spot similarities. Also looking at different sectors that might drive a potential upside, or more likely a decline. Interesting to compare also patterns of current NDAQ with DOW in 1929 and same NDAQ in 2000. Considering the macroeconomic situation surrounding us with reference to US: Shiller CAPE, rate of *permanent* unemployment, potential bubbles in the tech sector, interest rate, MMT, "many fresh investors post-lockdoown". This is what I am expecting, after a slight decline till elections: • If president likes to WallST, minor pull-back then long bear market. • If new president doesn't like to WallST, steepening of bear market. Overall, this should match with your believes.
Thank you! Agree
so random, this borderlines clearvoyance
Very similar to my own forecast though I expect the current correction to be over with and the run up to the 4000 level to start from here.  As you said, everything seems to be happening faster and the magnitude of the swings differs slightly.
btw, what made you look back in the 60s and 70s?
I always review the charts to see if current patterns have happened before.
thank you very much Doctor!
Doc: the link please
i will tell the editors to add the links!
Sources [1] https://www.strategasrp.com/ [2] https://www.seasonalcharts.com/zyklen_wahl_dowjones_election.html [3] https://www.mcoscillator.com/learning_center/weekly_chart/crude_oil_10-year_lead_update/
Thanks for sharing.
Wow, this one is really exciting, thanks!
thank you!
Risk Disclosure: Trading in financial instruments and/or cryptocurrencies involves high risks including the risk of losing some, or all, of your investment amount, and may not be suitable for all investors. Prices of cryptocurrencies are extremely volatile and may be affected by external factors such as financial, regulatory or political events. Trading on margin increases the financial risks.
Before deciding to trade in financial instrument or cryptocurrencies you should be fully informed of the risks and costs associated with trading the financial markets, carefully consider your investment objectives, level of experience, and risk appetite, and seek professional advice where needed.
Fusion Media would like to remind you that the data contained in this website is not necessarily real-time nor accurate. The data and prices on the website are not necessarily provided by any market or exchange, but may be provided by market makers, and so prices may not be accurate and may differ from the actual price at any given market, meaning prices are indicative and not appropriate for trading purposes. Fusion Media and any provider of the data contained in this website will not accept liability for any loss or damage as a result of your trading, or your reliance on the information contained within this website.
It is prohibited to use, store, reproduce, display, modify, transmit or distribute the data contained in this website without the explicit prior written permission of Fusion Media and/or the data provider. All intellectual property rights are reserved by the providers and/or the exchange providing the data contained in this website.
Fusion Media may be compensated by the advertisers that appear on the website, based on your interaction with the advertisements or advertisers.
© 2007-2024 - Fusion Media Limited. All Rights Reserved.