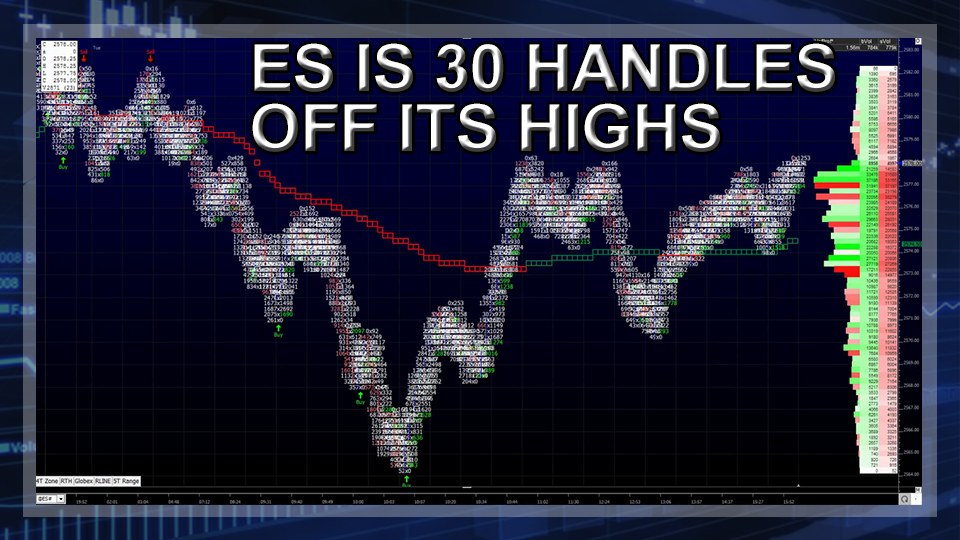
They say history repeats itself, well so does the S&P. On Monday morning there was a big selloff and rally, and yesterday there was another early selloff followed by a big rally. I know I have been off on my ES 2600 call for the last week or so, but you know what? The only thing I see these big selloffs doing is getting people short at lower prices and adding buy stops above the market. We know there was some global profit taking going on, and we know the tax reform bill is not going very smoothly, but the big drops and big pops don’t seem to be denting the S&P all that much. The front month ES (ESZ17:CME) contract high is 2594.50, and yesterday’s low was 2564.25, thats 30.25 handles off the high, which is about the ‘normal size’ of a pullback. Our rule after a high is 30 to 40 handles back.
After selling off down to 2570.00 Monday, the ES rallied back to 2582.25, then weakened going into the close as the MiM started showing decent size for sale, and continued to selloff overnight and into yesterday mornings open. The Globex range was 2582.25 to 2572.50 with a total off 225k ES traded. The first print on the 8:30 open was 2573.00, down 9 handles. After the open, the ES rallied just 1 tick short of the vwap at 2576.00, and then did a nose dive down to 2564.25 just after 9:00. After that, ES then popped back up to 2572.25, pulled back to 2568.25, and then shot up to 2578.25. From there, it pulled back just above the vwap at 2574.25, and then made two lower highs at 2577.50 and 2573.00 before dipping back down to 2570.25. The rest of the day was a sideways move higher as the MiM started to show over $400 million to buy and went on to settle at 2578.00 on the 3:15 futures close, down on 4 handle on the day.
The days trade was another great example of a big selloff early in the day that lost momentum, and then rallied. Once all the selling and sell programs were used up the ES shot higher. The S&P closed down 0.15%, and has now gone 50 sessions without a daily drop of 0.5% or more, the longest streak since 1965. The Dow closed at its lowest level in November, and crude oil had its biggest one-day drop in more than a month.
In the end the S&P 500 futures (ESZ17:CME) settled at 2578.00, down -4.00 handles, or -0.15%; the Dow Jones futures (YMZ17:CBT) settled at 23,375, down -31 points, or -0.13%; the Nasdaq 100 futures (NQZ17:CME) settled at 6293.50, down -18.50 points, or -0.29%; and the Russell 2000 (RTYZ17:CME) settled at 1470.50, down -3.10 points or -0.21% on the day.
As always, please use protective buy and sell stops when trading futures and options.
