
Over the last month, I have been tracking how the ongoing correction in the S&P 500 futures market should unfold using the Elliott Wave Principle (EWP). Back then, based on the available price data, I said that:
“I expect a bounce to 4500+/-25 soon from where the subsequent decline to ideally 4115+/-25 can start (green c/3). Once that target zone is reached, the index should bounce again to 4285+/-25 (4?), followed by a final decrease to 4015+/-25 (5? c, 4).“
Let’s see what happened using Figure 1 below.
Last week, when the index bottomed $4075, I wondered if that was all of green wave-5 or:
“if the market may have one more trick up its sleeve as that final stab lower - deeper in the ideal Fibonacci-based ES_F3959-4024 target zone- cannot yet be excluded just yet. A move above ES_F4303 will be an excellent first sign, with confirmation above ES_F4509. If those two levels are reached over the next few days and weeks, the anticipated rally to ES_F5500+ has most likely begun.”
With the index dropping to as low as $3953 today, let’s assess.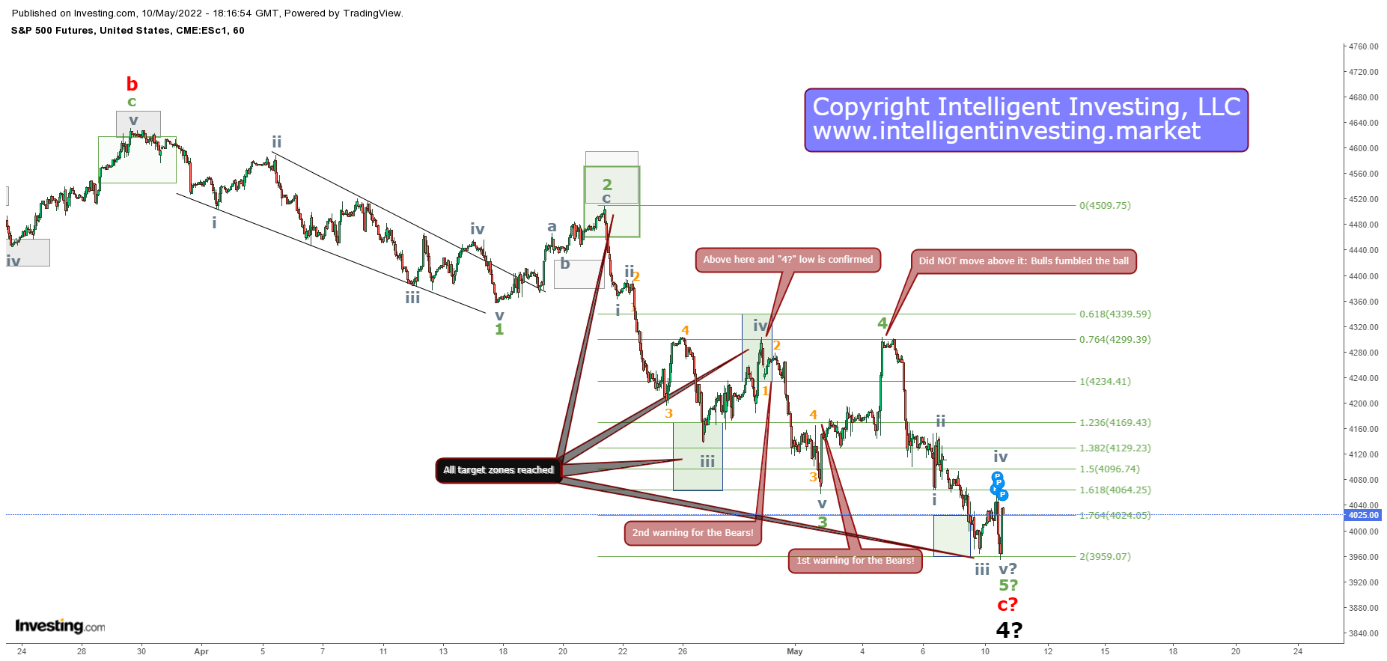
The Trick The Market Had Up Its Sleeve
Last week, the FED-induced rally topped out at $4303, and bulls fumbled the ball into the end zone, as they say in American football.
Four days later and the index reached the ideal $3959-4024 target zone. I had to adjust my EWP count from a green wave-3, and 4 made on April 26 and 28 to May 2nd and 4th instead.
These minor adjustments are expected as one cannot get/interpret every market move correctly and why I stated that the market could have one more trick up its sleeve. Indeed, as shown in Figure 1, the index has followed the ideal Fibonacci-based EWP-impulse path already laid out a month ago (see here) reasonably well.
Bottom Line
Last week, bulls failed to clear $4309. The market had materialized the dreaded:
“one more trick up its sleeve as that final stab lower - deeper in the ideal ES_F3959-4024 target zone.“
At this stage, the index could have a few smaller scribbles left to reach potentially as low as $3925+/-5 for a picture-perfect c=a relationship. Still, per the EWP, it now has done enough waves since the late-March bounce high to consider the entire correction complete.
A break back above $4153 will be the first warning for the bears. The 2nd warning is $4303, and the 3rd and final sign stands at $4509. When those levels are breached, the next and final run to SPX5500+ should be underway.