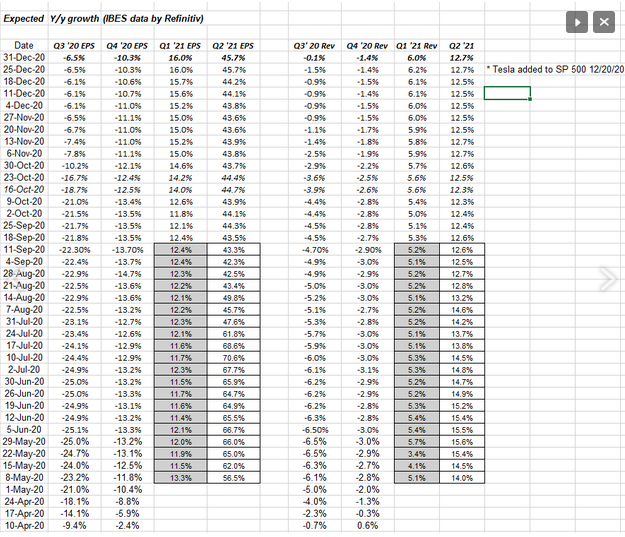
With 499 of the S&P 500 having reported Q3 ’20 financial results, year-over-year “growth” (or declines rather) for the S&P 500 was -6% for EPS and -0.9% on revenue.
If we look back at the expected declines as of early October before the 3rd quarter financial results started being reported, per the IBES data, Q3 ’20 S&P 500 EPS growth was expecting to be -21.5% y/y and revenue growth expected at -4.4%.
The 2nd and 3rd quarters of 2020 had very strong “beat rates” and “upside surprises” within the S&P 500.
The big reporting day this coming week will be Thursday, January 7th, 2021 when Walgreens Boots Alliance (NASDAQ:WBA), Micron Technology (NASDAQ:MU) and ConAgra Foods (NYSE:CAG) report their November ’20 quarters.
Let’s look at the numbers this week that ended 12/31/20:
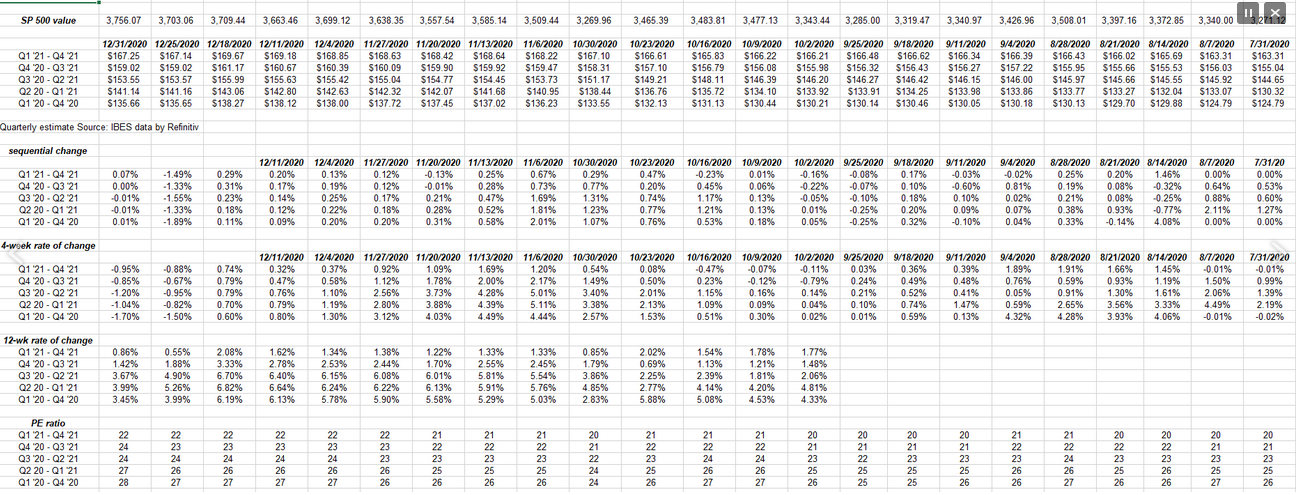
- The forward 4-quarter estimate that ended 2020 was $159.02 vs last week’s $159.01. If we look ahead one week and calculate the new forward 4-quarter estimate (which is really the calendar 2021 estimate as of today, 12/31/20), next week’s “forward 4-quarter” will come in around $167.25, for an increase of over $7 or 10%. That new forward estimate will be influenced by what happens with Thursday’s earnings results, any pre-announcements by S&P 500 companies, and what happens in Georgia.
- The PE ratio on the S&P 500 for 2021 today is now 22x expected 2021 S&P 500 EPS.
- The “average” expected growth for calendar 2020 and 2021 S&P 500 EPS is 3%.
- The S&P 500 earnings yield as of 12.31.20 is 4.29% the lowest since August 8, 2020. However if we plug in the $167 EPS estimate, the earnings yield jumps to 4.45%.
Here’s the S&P 500 Forward Earnings Curve:

The forward EPS curve shows the multiples quarter-by-quarter. On April 1, 2021 we will start to see the bottom-up quarterly estimates for 2022 and likely see the first S&P 500 EPS estimate for 2023.
The “4-week rate-of-change” is still being impacted by the Tesla (NASDAQ:TSLA) addition to the S&P 500. The sequential rate of change was stable this week. Let’s watch both as the initial Q4 ’20 financial results start to get reported.
Have early 2021 S&P 500 estimates changed much ?

Not yet (to answer the question directly). Preannouncements this week, and the earnings results Thursday will give us insight to Tech and retail drug stores but investors may not see real changes to 2021 quarterly growth rates until the banks start reporting mid-January, ’21.
Interesting S&P 500 EPS statistic:
- 2021 est S&P 500 EPS: $167.25 +23% expected y/y growth
- 2020 est S&P 500 EPS: $137 -17% y/y decline (estimated w Q4 ’20 earnings releases pending)
- 2019 actual S&P 500 EPS: $162.93 +1% y/y growth
- 2018 actual S&P 500 EPS: $161.93 +23% y/y growth
- 2017 actual S&P 500 EPS: $132.00 +12% y/y growth
If 2020 and 2021 expected S&P 500 EPS doesn’t change much, the “average” growth for S&P 500 earnings since Jan 1, 2017 is 8%.
The “average, annual return” for the S&P 500 since Jan 1, 2017 is 16%.
In other words, the PE expansion since 1/1/17 has been twice the actual rate of growth of S&P 500 earnings, which is what worries me about the Georgia Senate Races and potential for corporate income tax rate increases.
If the “Blue Wave” does happen for the Dems Tuesday, January 5th, 2021, and there is enough to get a corporate tax increase passed through the Congress, conceivably – with a return to a 28% – 29% corporate income tax rate – the 2021 expected S&P 500 EPS could fall to into the $145 – $150 range.
Just doing the math, from the $132.00 actual 2017 S&P 500 EPS to the potential for a $145 – $150 2021 S&P 500 EPS, that would mean that actual S&P 500 EPS grew just a little under $4 per share per year from 2018 – 2022.
I don’t think the S&P 500 or the US stock market would receive that very well.
An increase in the corporate tax rate back to what it was “pre-TC&JA” would likely be a “PE compressing” event.
Summary / conclusion: Until we see what happens Tuesday, January 5th and then with the Congressional certification of the US Presidential election, it could be an interesting week. The 23% actual growth rate in S&P 500 EPS “tax-aided” in 2018 with the passage of the TC&JA in late 2017. Given everything we know today, that is what I see is the big risk for 2021 and it all depends on the Georgia Senate Races.
The hallmark of secular bull markets in stocks is “PE expansion” and an increase in the corporate income income tax rate back into the high 20% likely won’t be well received by the US stock market.
However, it’s all speculation until we see the results Tuesday, January 5th. 2021.
Today’s post was a little “what can go wrong in 2021 in terms of S&P 500 EPS” and Georgia is a risk. It’s not the only risk though.
Many on the sell-side are very bullish and that worries me too.
Thanks for reading.
