The earnings per share (EPS) for all S&P 500 companies combined declined slightly to $175.23 this week.
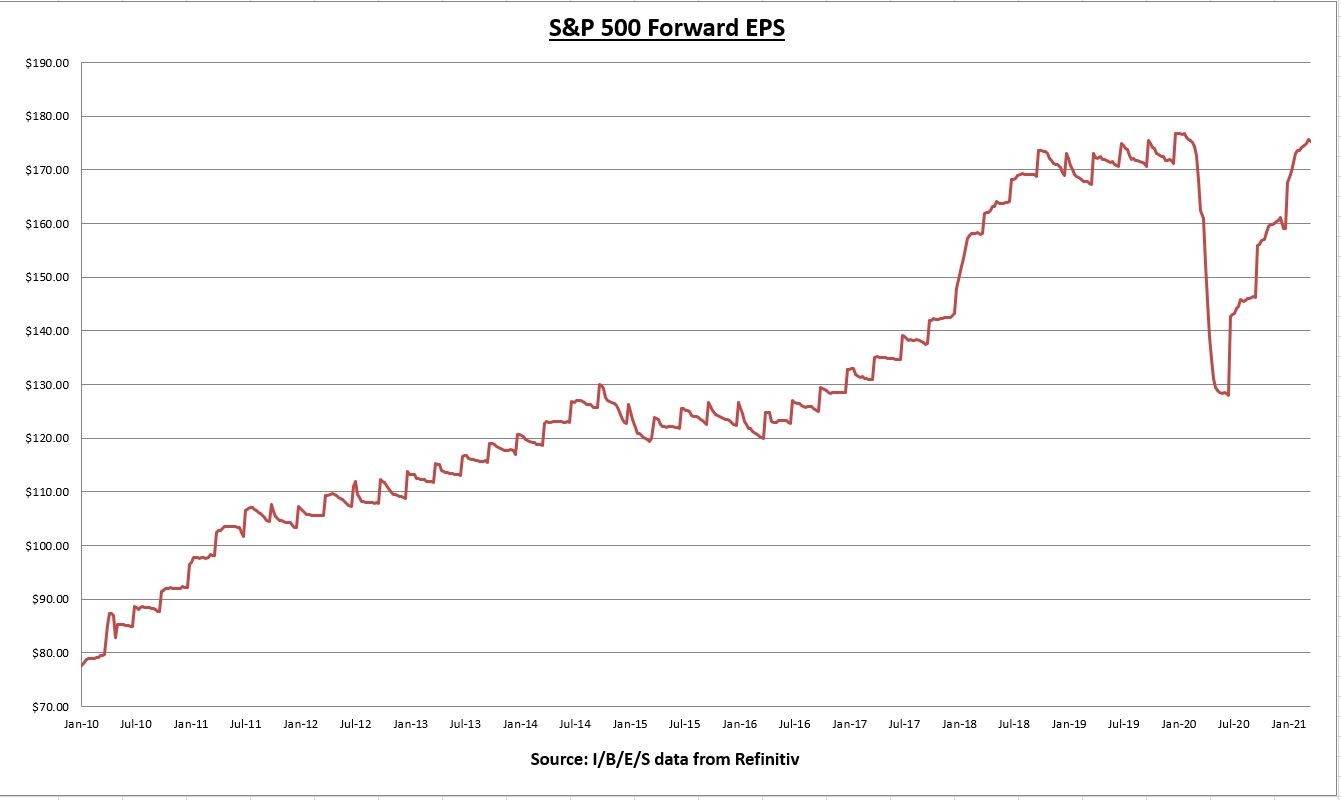
The forward EPS is +10.2% so far this year. I expect a sizeable increase in the EPS as we roll into the new quarter, probably as early as next week.
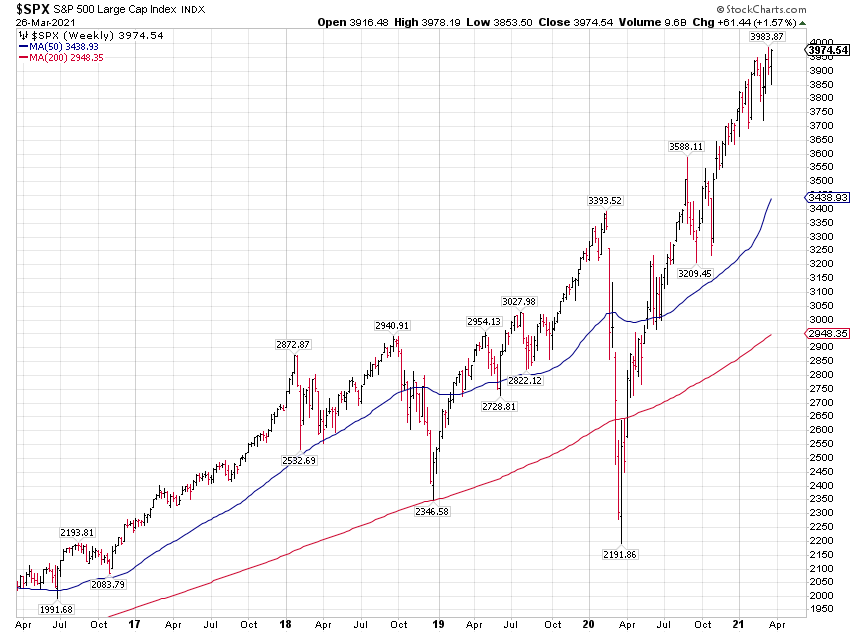
The S&P 500 index increased 1.57% this week. Another all-time closing high.
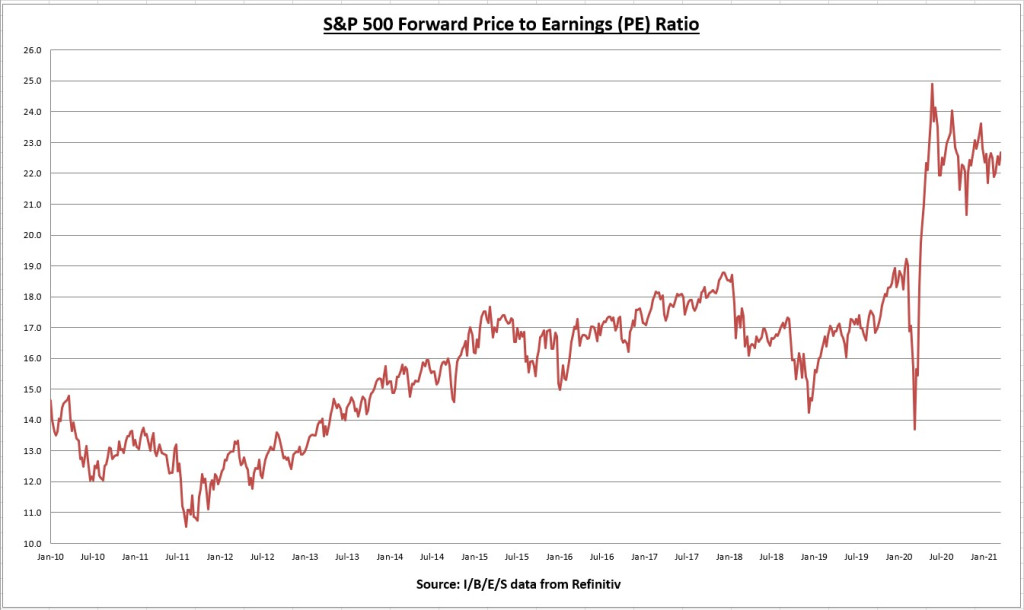
The slight decline in EPS this week plus the increase in price pushes the price to earnings (PE) ratio up to 22.7
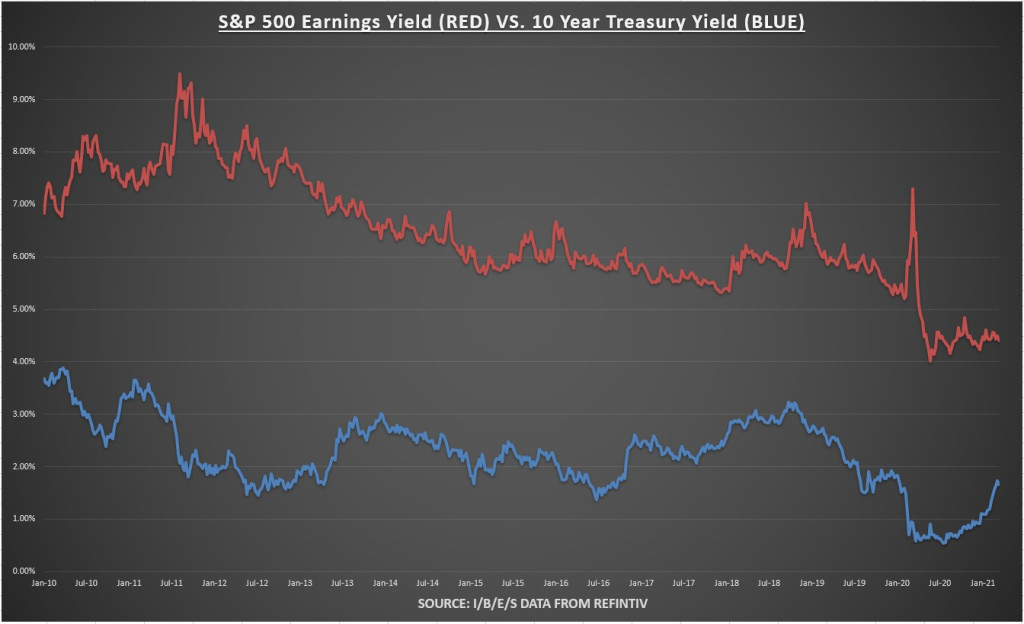
The earnings yield on the S&P 500 is now 4.41%, while the 10-year treasury yield declined to 1.66% (the first weekly decline since the week ending January 15th), making the equity risk premium (earnings yield minus 10 year treasury rate) 2.75%. Stocks are still reasonably priced even at these levels.
Economic data review
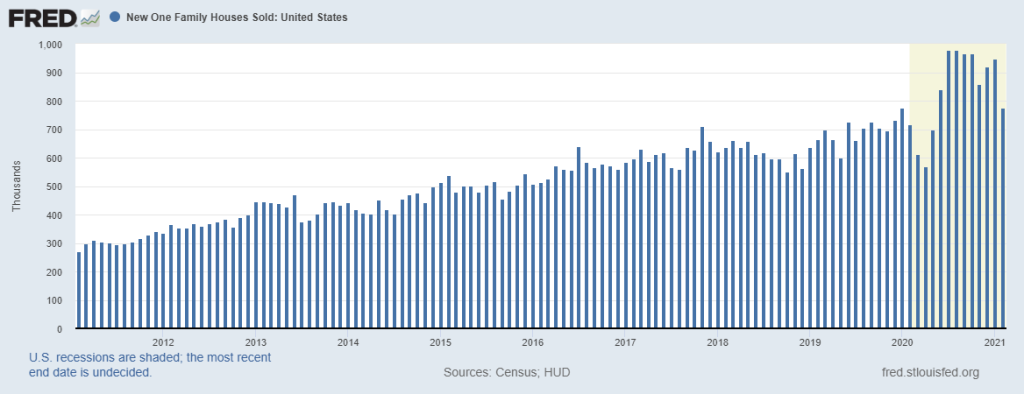
New home sales for February came in at 775K, well below the streets expectations of 872K. Although January’s number was revised higher, from 923K to 948K. February’s results were down 18.3% for the month, but still up 8.2% from this time last year. The declines were relatively broad based across regions, but the biggest decline was in the Midwest (-37.5%) which was dealing the harsh winter weather.
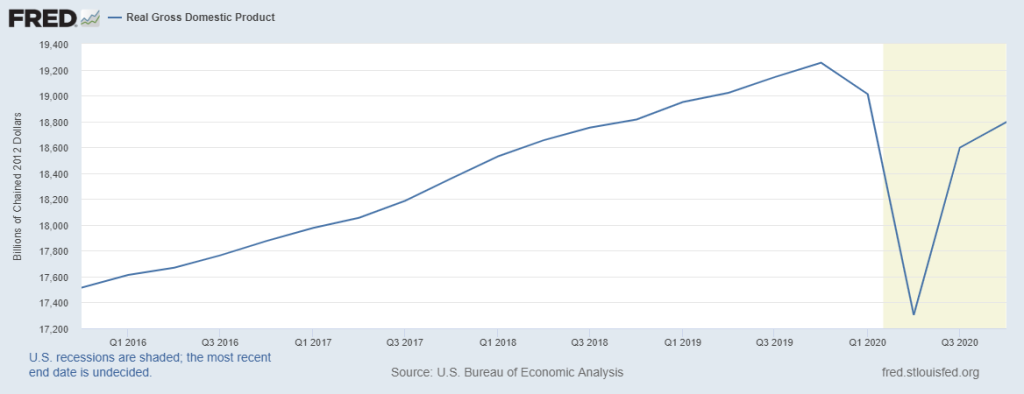
Q4 GDP was revised up from +4.1% to +4.3%. This was the third and final update for Q4. The economy as a whole has now recovered 76.5% of the COVID losses on an inflation adjusted basis. Current estimates for Q1 GDP are around +5%. If actual results are +5% growth in Q1, the economy would have recovered 90% of the COVID recession.
2020 is now officially in the books. 2020 real GDP declined -3.5%, the worst year since 1946 (-11.6%). But its all about looking ahead to a brighter future.
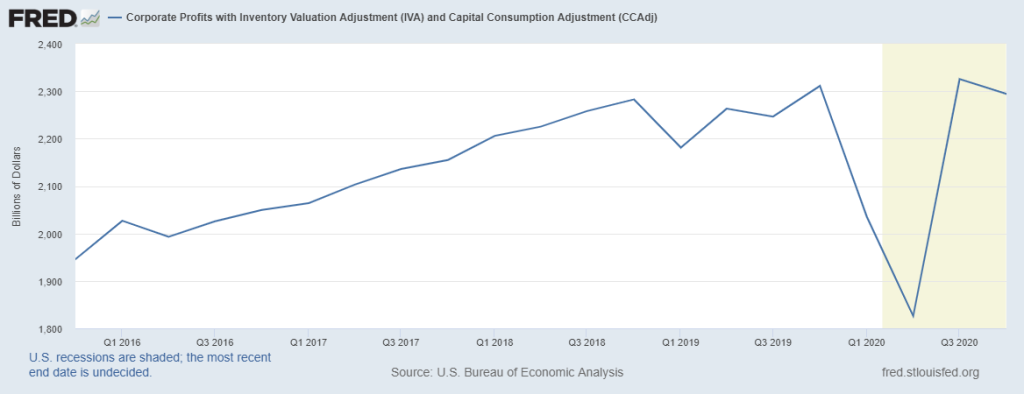
The third and final quarterly GDP update includes the Q4 quarterly corporate profits data. Corporate profits declined -1.4% in Q4, from the record high in Q3. And profits are down -0.7% below Q4 2019. A solid result considering one of the worst years for the economy, and based on S&P 500 earnings projections, I expect corporate profits to continue to improve going forward.
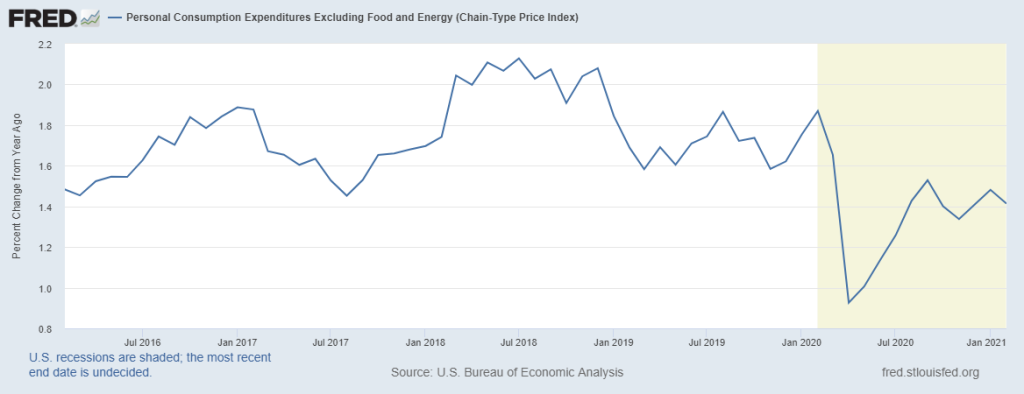
Personal Consumption Expenditures (PCE) excluding food and energy (core PCE) was up 0.1% in February, but on an annualized basis core PCE declined from 1.48% to 1.41%. Core PCE is the Fed’s preferred reading on inflation. Part of their dual mandate before raising short terms rates is for Core PCE to average above 2% for some time. Clearly no threat of this yet.
Notable earnings
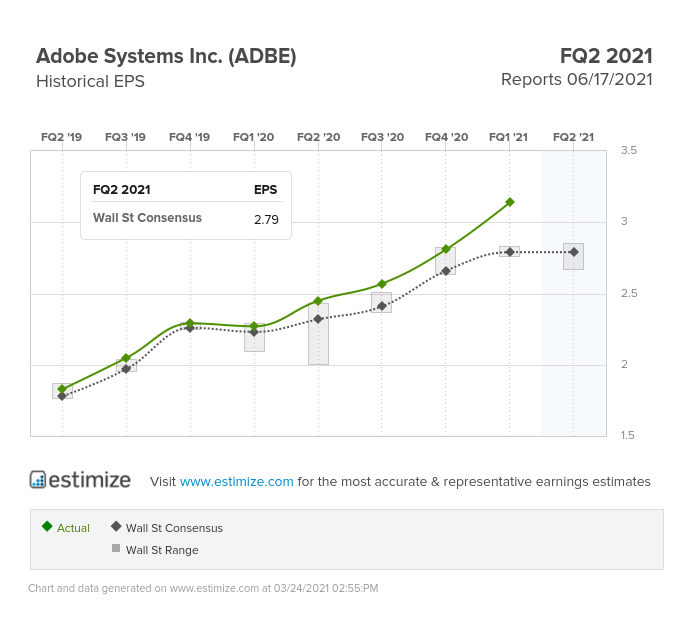
Software – infrastructure company Adobe (NASDAQ:ADBE) reported an adjusted EPS that beat expectations, growing 38% year over year.
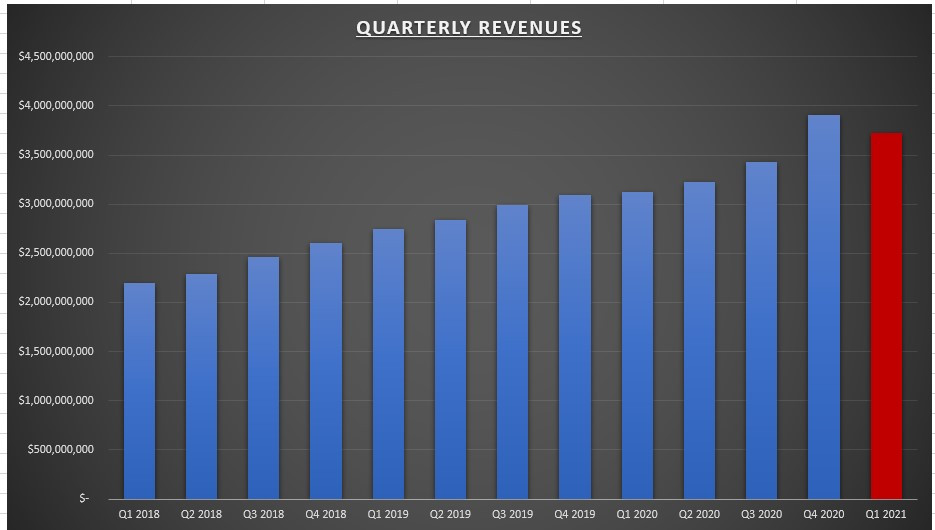
And revenues that also beat expectations, at $3.9 billion, another all time high, growing 26% year over year. The company guided for Q1 revenues of $3.7 billion (growth rate of 19% year over year but -5% sequentially), and fiscal 2021 revenue growth of 20% (compared to 15% growth in 2019).

Solid margin expansion during the quarter, as gross margins improved both sequentially and year over year at 88.6% (all time high), while operating margins also improved both sequentially and year over year at 37.2% (an all-time high). Impressive results all around.
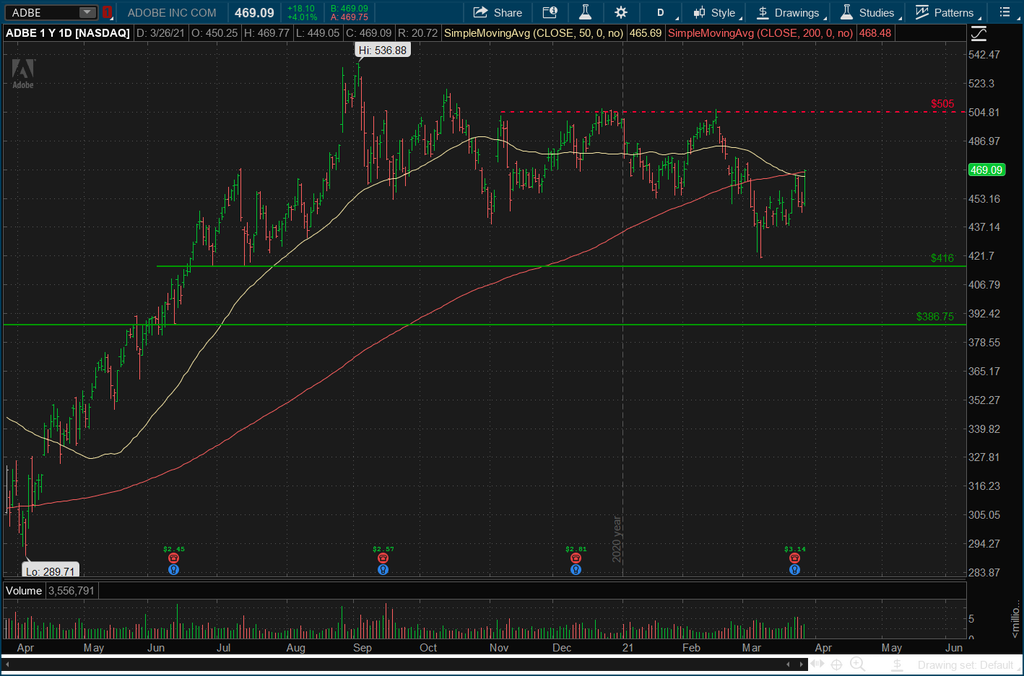
The stock is in a battle to get back above the 50 and 200 day averages. I’d look to the prior swing low around $416 and the prior swing high at $387 to come into play if the stock can’t stay above those key moving averages. I would be adding on any declines in this stock. I know it trades at a high forward PE and price to sales, but the earnings and free cash flow yield is still attractive even at current prices IMO.
Chart of the week
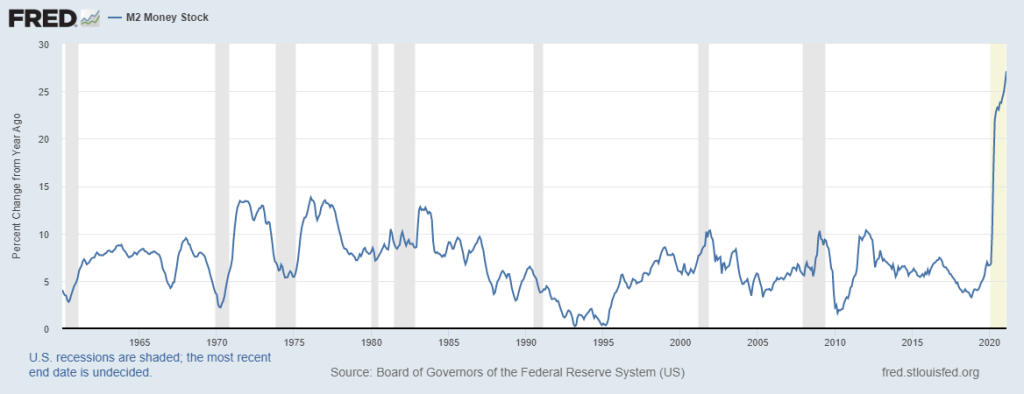
This week we got the latest reading of the M2 money supply. M2 is now up +27.1% higher than this time last year. This is a percentage gain not seen since the dataset began in 1960, and almost double the prior highs made in the 1970’s. When I talk about inflationary concerns, this is the source of the problem. The Fed still believes the inflationary effects will be temporary. I hope they are right. But comparisons between the fiscal/monetary response to the 2008 financial crisis and today fall short in light of this chart. The 2008 response didn’t increase the money supply anything close to what we are seeing today.
Summary
Stocks follow earnings and interest rates. Record high earnings/corporate profits combined with still negative real interest rates is a recipe for higher stock prices. It’s as simple as that (simple, but not easy!). And combine that with a Fed that is doubling down on not raising short term rates until at least 2024 (I have my doubts on this, but we’ll see), and unprecedented fiscal stimulus too.
I’m not surprised to see the tech heavy NASDAQ index lag behind the broader market. The NASDAQ is down about 7.5% from all time highs, while the S&P 500 made a new weekly closing high. Remember, a lot of those stocks produced 3-5 years worth of gains all in one year. Plus, if tax rates are going up, it makes sense for those affected to take gains now and pay a lower tax rate.
Speaking of higher taxes, I’m not too concerned with the current proposals. Since WWII there has been 13 years when taxes were raised, the S&P 500 finished positive in 12 of the 13 years, with an average gain of 9%. Yes, higher corporate taxes reduce profitability. So it is a negative in that regard. But I don’t see it as being enough to significantly change the fundamentals, at least not yet.
That being said, if you look at the S&P 500 chart at the top of the post, you can see we’ve climbed a long way in a short time. The market averages a 10% correction roughly every 12-18 months even during good times. You’ll never time them with any consistency, so it doesn’t make sense to try (unless you’re a trader of course). Make sure you are well diversified and take advantage of the opportunities as they present themselves. As Warren Buffett said, “We don’t have to be smarter than the rest. We have to be more disciplined then the rest.”
Next week we have 6 S&P 500 companies reporting earnings. For economic data, we have consumer confidence on Tuesday, ISM Manufacturing PMI on Thursday, and the all important jobs report on Friday.

