Get 40% Off
👀 👁 🧿 All eyes on Biogen, up +4,56% after posting earnings. Our AI picked it in March 2024.
Which stocks will surge next?
Unlock AI-picked Stocks

S&P 500 Earnings: The Shining

Published 08/24/2017, 11:02 AM
Updated 07/09/2023, 06:31 AM

S&P 500 Operating Earnings Per Share

The earnings recession is over. S&P 500 operating earnings per share were eclipsed by the energy recession from Q4-2014 through Q2-2016, when the Thomson Reuters (TR) measure was flat to down on a y/y basis. Growth resumed during the second half of 2016 and first half of 2017.

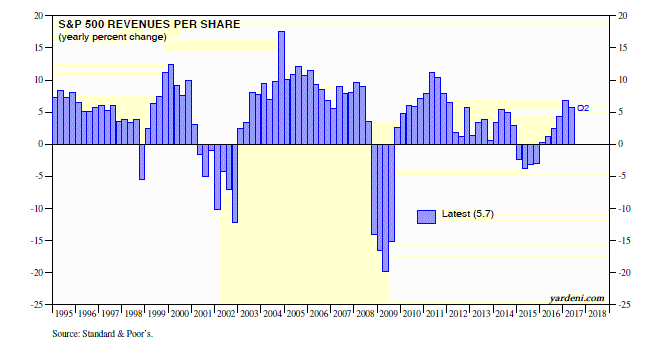
The TR measure of earnings rose 10.1% y/y during Q2-2017 to a new record high, while revenues rose 5.7% y/y.

That put the S&P 500 operating profit margin (based on TR data) at a record high of 10.8%. “Ouch” is the sound you just heard from all those reversion-to-the-mean bears, who can go back to sleep. The 52-week forward outlook looks outstanding:

(1) S&P 500 forward revenues per share, which tends to be a weekly coincident indicator of actual earnings, continued its linear ascent into record-high territory through the week of August 10.

(2) S&P 500 forward operating earnings per share, which works well as a 52-week leading indicator of four-quarter-trailing operating earnings, has gone vertical since March 2016. It works great during economic expansions, but terribly during recessions. If there is no recession in sight, then the prediction of this indicator is that four-quarter-trailing earnings per share is heading from $126 currently (through Q2) to $140 over the next four quarters.

Some sectors shone more brightly than others during Q2. Here is the y/y performance derby for the S&P 500 revenues growth: Energy (14.3%), Tech (9.7), Industrials (7.8), S&P 500 (5.7), Utilities (5.3), Consumer Staples (4.8), Financials ex-Real Estate (4.4), Consumer Discretionary (3.5), Health Care (2.4), Real Estate (0.8), Materials (-1.4), and Telecom (-3.9).

3rd party Ad. Not an offer or recommendation by Investing.com. See disclosure here or remove ads .

Here is the same for earnings growth: Energy (returned to a profit), Telecom (45.8%), Tech (34.3), S&P 500 (19.6), Utilities (14.2), Financials ex-Real Estate (13.0), Industrials (12.5), Health Care (8.6), Consumer Staples (6.7), Consumer Discretionary (1.9), Materials (-0.4), and Real Estate (-14.6).

S&P 500 Revenues Per Share

Original Post

Latest comments

Risk Disclosure: Trading in financial instruments and/or cryptocurrencies involves high risks including the risk of losing some, or all, of your investment amount, and may not be suitable for all investors. Prices of cryptocurrencies are extremely volatile and may be affected by external factors such as financial, regulatory or political events. Trading on margin increases the financial risks.
Before deciding to trade in financial instrument or cryptocurrencies you should be fully informed of the risks and costs associated with trading the financial markets, carefully consider your investment objectives, level of experience, and risk appetite, and seek professional advice where needed.
Fusion Media would like to remind you that the data contained in this website is not necessarily real-time nor accurate. The data and prices on the website are not necessarily provided by any market or exchange, but may be provided by market makers, and so prices may not be accurate and may differ from the actual price at any given market, meaning prices are indicative and not appropriate for trading purposes. Fusion Media and any provider of the data contained in this website will not accept liability for any loss or damage as a result of your trading, or your reliance on the information contained within this website.
It is prohibited to use, store, reproduce, display, modify, transmit or distribute the data contained in this website without the explicit prior written permission of Fusion Media and/or the data provider. All intellectual property rights are reserved by the providers and/or the exchange providing the data contained in this website.
Fusion Media may be compensated by the advertisers that appear on the website, based on your interaction with the advertisements or advertisers.
© 2007-2024 - Fusion Media Limited. All Rights Reserved.