
Stocks closed at a local low yesterday, but today the market will likely be trying to retrace the decline. So, is the S&P 500heading lower soon?
The broad stock market index lost 0.46% yesterday as it got back to Wednesday’s local low. It even went below the 4,500 level. Last Thursday (Sept. 2) the index reached a new record high of 4,545.85. The index remains elevated after the recent run-up, so we may see some more profound profit-taking action at some point.
The nearest important support level of the broad stock market index remains at 4,490-4,500, and the next support level is at 4,465-4,470, marked by the previous Thursday’s low. On the other hand, the nearest important resistance level is at 4,550. The S&P 500 bounced from its four-month-long upward trend line recently, as we can see on the daily chart (chart by courtesy of http://stockcharts.com):

Dow Jones Extended Its Short-Term Downtrend
Let’s take a look at the Dow Jones Industrial Average chart. The blue-chip index broke below a potential two-month-long rising wedge downward reversal pattern this week. It remains relatively weaker, as it didn’t reach a new record high like the S&P 500 and the NASDAQ Composite. The support level is now at around 34,750 and the near resistance level is at 35,000, as we can see on the daily chart:

Apple (NASDAQ:AAPL) Retraced the Recent Advance
Apple stock weighs around 6.3% in the S&P 500 index, so it is important for the whole broad stock market picture. On Tuesday it reached a new record high of $157.26. Since then it has been declining. We can still see negative technical divergences between the price and indicators and a potential topping pattern. The two-month-long upward trend line remains at around $145, and the nearest important support level is now at $150-152.

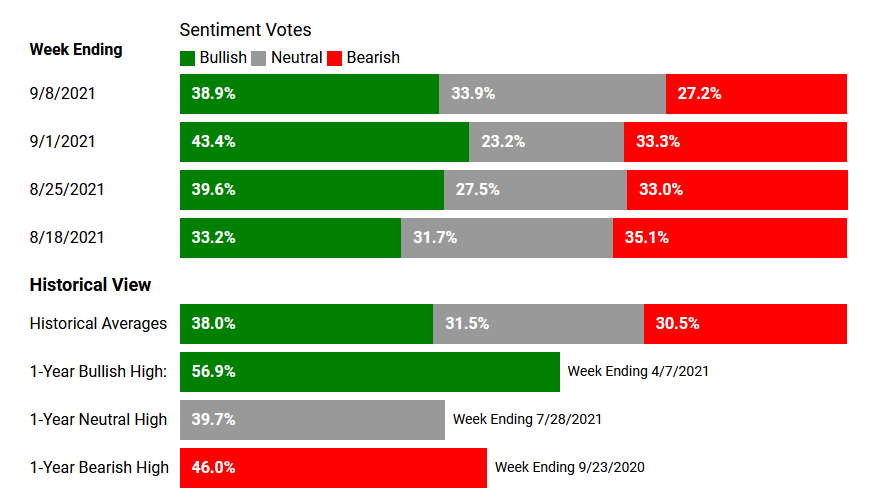
AAII’s Sentiment Is Less Bearish
On Wednesday we’ve got the latest reading of the American Association of Individual Investors Sentiment Survey. There was a relatively big decline in bearish sentiment last week and an accompanying drop of neutral votes. So, individual investors are clearly less bearish right now, and that may be another sign of a topping action of the stock market. (chart by courtesy of http://www.aaii.com)
Conclusion
Yesterday, the S&P 500 index went below the 4,500 level again. For now, it looks like a correction within an uptrend. Today, we will most likely see a higher opening of the trading session – we may see another profit-taking action later in the day though.
The market seems short-term overbought, and we may see some downward correction soon. Therefore, we think that the short position is justified from the risk/reward perspective.