Get 40% Off
⚠ Earnings Alert! Which stocks are poised to surge?
See the stocks on our ProPicks radar. These strategies gained 19.7% year-to-date.
Unlock full list

S&P 500 Approaching Defining Moment

Published 06/24/2020, 01:31 PM
Updated 05/14/2017, 06:45 AM

Stocks extended Monday's gains, yet retreated from the daily highs – how bullish is that?

The short-term outlook hasn't changed as the S&P 500 still trades within Tuesday's intraday confines – we lack a clear short-term direction. In today's analysis, I'll cover what has changed and what has not since we last spoke. I'll also discuss the overnight dip on renewed corona fears – as if this news piece just arrived out of the left field. Yet, the market seems getting sensitive here.

S&P 500 in the Short-Run

I’ll start with the daily chart perspective (charts courtesy of http://stockcharts.com ):

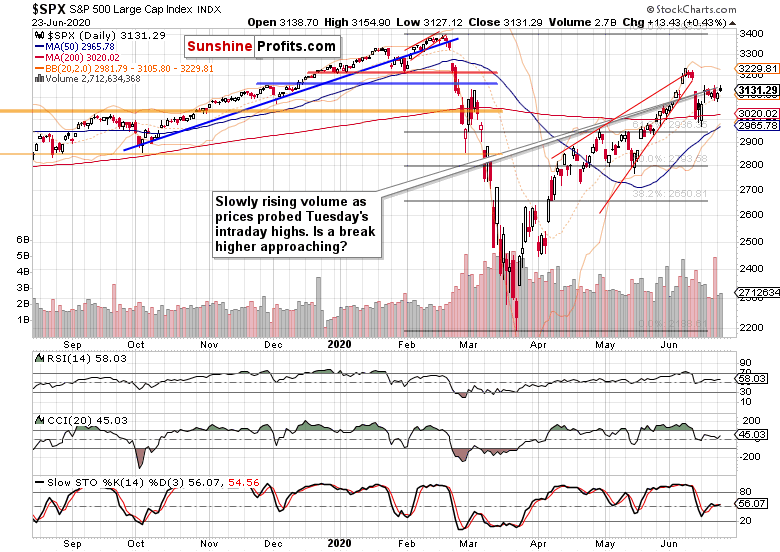
Monday and Tuesday have given us bullish price action, but the trading range of recent days hasn't been changed. Take a look at the price congestion, it's taking five trading days in a row already – the upcoming move either way would be sizable.

While yesterday's volume rose, it didn't increase enough to drive meaningful conclusions. Neither the daily indicators are clearly pointing either way in the short run.

In Monday's aftermarket, it was the Navarro–Trump exchange that hammered stocks.

The runup to today's regular session can be characterized by the corona second wave fears.

Such were my observations from today's intraday Stock Trading Alert:

Stocks appear to be getting increasingly spooked by the second wave fears, though all the pieces of the puzzle had been with us for quite a time already. Nonetheless, that spells a high likelihood of things not going the bullish way.

Yes, tensions are running high, and stocks have so far rebounded each time. But we all feel that the headline risk in this data-light week is skewed rather to the downside. Raise your hands if you expect another stimulus this week. That's it.

Technically, we see that downside risk precisely on the weekly chart – let's recall my comments from Monday:

The weekly chart shows last week's battle precisely. After reversing prior week's selloff on Monday and Tuesday, stocks stalled on Wednesday and Thursday. Friday's session opened encouragingly, and it appeared the bulls will close the week decently. Yet, despite two intraday rebounds, the sellers proved to be in the driving seat.

This week's candle got a bearish flavor as a result. The lower volume isn't as concerning as the upper shadow. The extended weekly indicators are whispering caution here as well, regardless of being still fit to power one or a few weeks of more upside before consolidating.

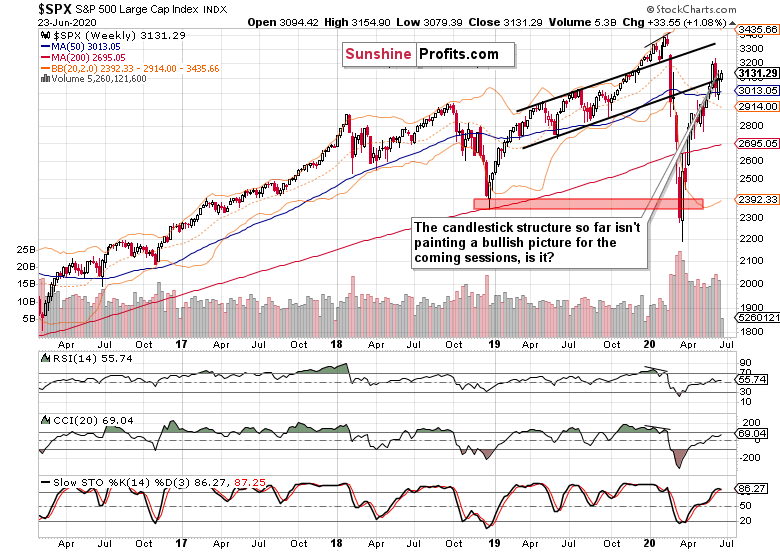
The candle-in-progress has caution written all over itself. The weekly chart also highlights the potential for quite some sideways trading. As I wrote earlier, stocks are in for a bumpier ride.

What would the credit markets say about the coming break's direction?

The Credit Markets’ Point of View

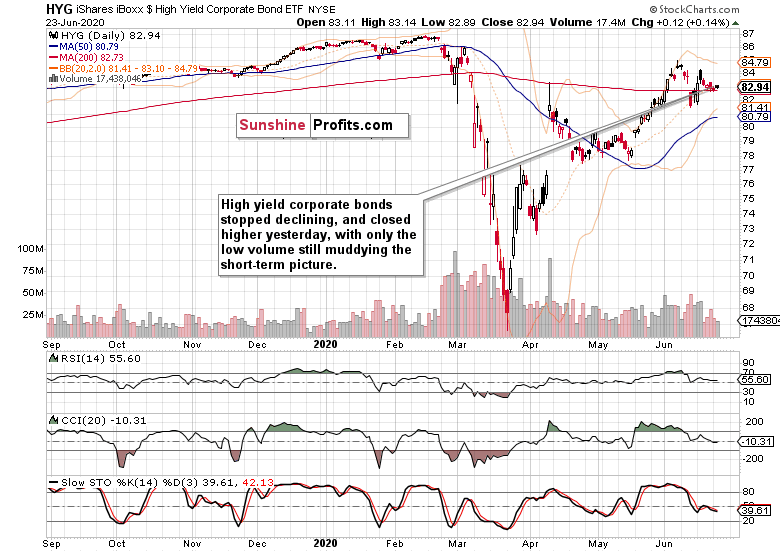
High-yield corporate bonds HYG ETF (NYSE:HYG) finally rose yesterday, but the volume was lackluster.

Does it mean an upswing will follow, or does this fact make it hard to trust it? As is the case with stocks, I look for downside vulnerabilities here, too.

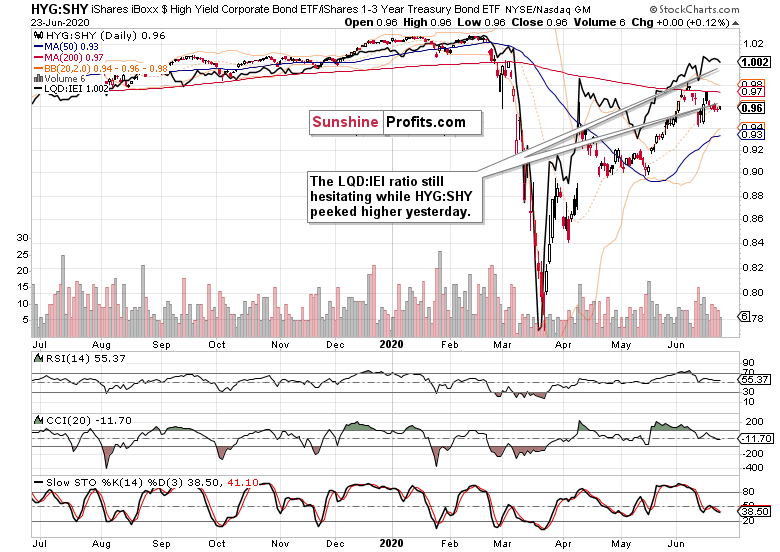
It's certainly concerning that investment grade corporate bonds to the longer-term Treasuries (LQD:IEI) ratio turned slightly lower yesterday, while the high-yield corporate bonds to short-term Treasuries one (HYG:SHY) rose. That';s a short-term red flag.

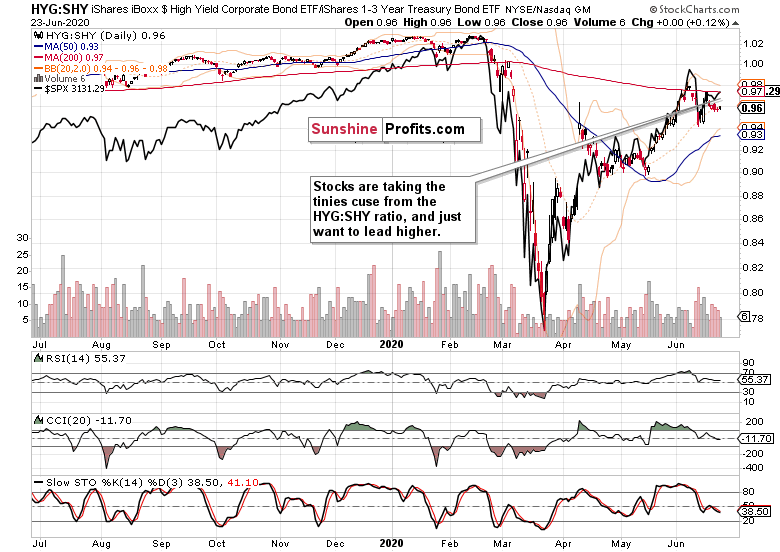
The S&P 500 peeked higher yesterday, while the HYG:SHY ratio followed upwards, too. But the net result is another short-term overextension in stocks, and that can turn on a dime.

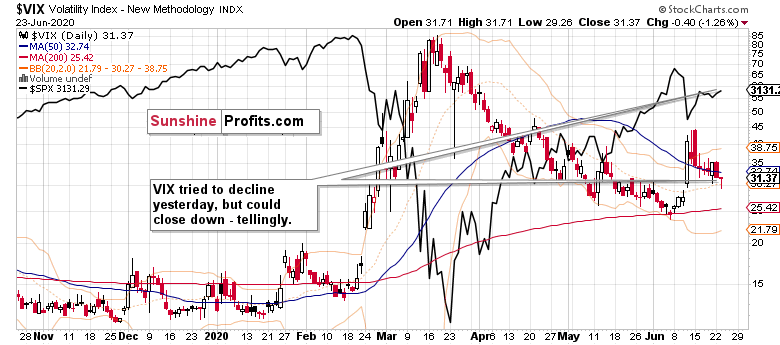
The favorite volatility measure, the VIX, also shows that not everything as regards the downside, might be already in. This forward-looking metric appears not to be in the mood to decline much more.

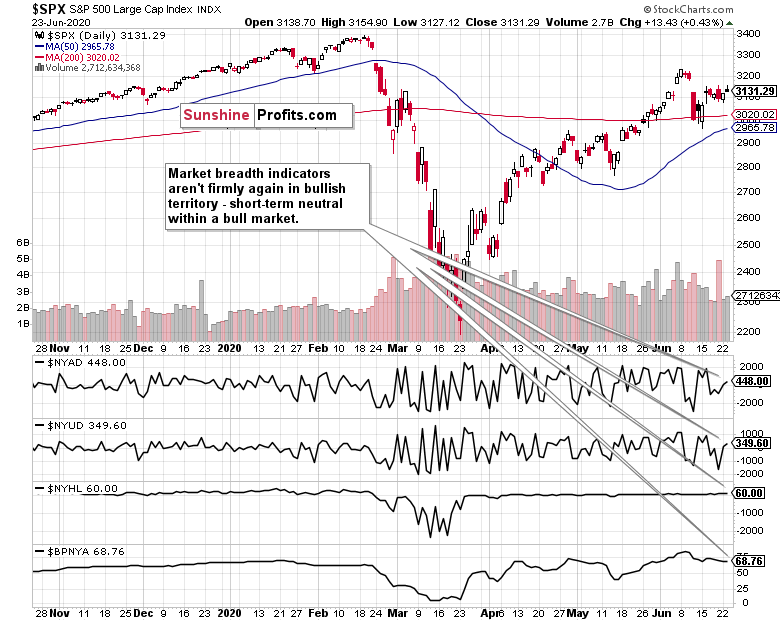
The market breadth indicators also paint a picture of the bulls not being at their strongest this very moment. The bullish percent index is declining, which shows bullish juices on the wane.

Summary

Summing up, the risk-on sentiment went on reasserting itself yesterday, but hasn't really changed anything in terms of outlook. On the other hand, the warning signs of a sizable move ahead are mounting, and they spell caution for the bulls. The S&P 500 remains vulnerable to a short-term steep slump as we've seen late on Monday and in today's premarket. The $VIX reveals that volatility might not have calmed down just yet, and the prospect of a more bumpier ride ahead for the bulls over the summer, remains on. Time to continuously assess whether stocks are or aren't getting ahead of themselves relatively speaking, and expect more risk-off environment in the weeks ahead. Right now, they are again very short-term extended.

Latest comments

If asset prices go up, but the cash flows they represent goes down, wouldn't that lead to indifference between the assets and the dollars. The yield are way too low on bonds for anyone to buy except those in the captive market. No one in their right mind thinks inflation will be low enough that yield in bonds or stocks makes any sense.  That captive market is huge though. All those countries with trade surpluses, banks, pension funds, ect. looking for safety, but is it actually safe now? If I were a European banker I would probably rather just invest in my home country where I felt I understood the situation better.
I'm taking your comment in the upcoming article, thank you.
 Thanks! Look forward to reading it.
Hi Monica. Great technical analysis. Another indicator you might want to include with your analysis is Fundamental analysis market index S&P500 PE currently just under 22, above the LT average of 16. Even with zero ST interest rates, given an expected decline in earnings, the index PE will continue to rise and then sell off until “fair value” is reached. Fair value could result in a S&P 500 value of 2100-2700, depending on actual earnings and PE.
Thank you for the appreciation, I'll answer your question in the coming article
As long as FED locks the prices it is a short term push back. However and given the C-19 figures, it's time.to fight FED substantialy Remember BoE lost a battle, FED will definitely loose this war, when it tries do go all in ...
You correctly use the terminology: war vs. battle
All red candles last two weeks are of such a fat volume. Doesn't that stink of distribution to you? Oh I forgot,  in the long run stonks are bound to rise.
Thank you, I'm answering your question (merged with Paulo Britto's one) in today's article. Have a good day!
Hi Monica, the analysis is great but I think there are missing some graphic details in the chart, specifically related to the June 11th drop. There you can see the angle that is being proposed by the market that is being reproduced today. My current understanding is that we are following the patterns close to the start of a bear market and we are finishing the second part this week.
Thank you, I'm answering your question in today's article. Have a good day!
Hi Monica, actually I opened Buy position S&P in the morning. unfortunately I am in big loss now,.. now shall I close my position now, or wait for tomorrow... do you see S&P going more down from this point ??
Same time I bought long... puts. Never thought a put 4 months away would yield almost 30% profit on a moderate asset plunge. Didn't close it yet, though.
wait for a couple of days . see the movement. take the bet.
Taking your comment too, thank you :)
Monica, what resistance level are looking for in case of a big drop?
Monica......1500? Am i reading correctly? Yes, i foresee an opportunistic pullback, but to 1500??? Just wow.
 if covid19 patients evolved into zombie, lol
 I didn't say 1500, I just asked the commenter whether he can imagine a real world situation reflecting that number, that's all :)
Risk Disclosure: Trading in financial instruments and/or cryptocurrencies involves high risks including the risk of losing some, or all, of your investment amount, and may not be suitable for all investors. Prices of cryptocurrencies are extremely volatile and may be affected by external factors such as financial, regulatory or political events. Trading on margin increases the financial risks.
Before deciding to trade in financial instrument or cryptocurrencies you should be fully informed of the risks and costs associated with trading the financial markets, carefully consider your investment objectives, level of experience, and risk appetite, and seek professional advice where needed.
Fusion Media would like to remind you that the data contained in this website is not necessarily real-time nor accurate. The data and prices on the website are not necessarily provided by any market or exchange, but may be provided by market makers, and so prices may not be accurate and may differ from the actual price at any given market, meaning prices are indicative and not appropriate for trading purposes. Fusion Media and any provider of the data contained in this website will not accept liability for any loss or damage as a result of your trading, or your reliance on the information contained within this website.
It is prohibited to use, store, reproduce, display, modify, transmit or distribute the data contained in this website without the explicit prior written permission of Fusion Media and/or the data provider. All intellectual property rights are reserved by the providers and/or the exchange providing the data contained in this website.
Fusion Media may be compensated by the advertisers that appear on the website, based on your interaction with the advertisements or advertisers.
© 2007-2024 - Fusion Media Limited. All Rights Reserved.