What will the S&P 500 bring next week? That is the subject of discussion in our next premium analysis due out late Sunday!
The coronavirus pandemic forced the global economy to grind to a halt. Major U.S. stock market indices made their fastest plunge into bear market in history. In less than two months, DJIA and the S&P 500 lost 38.4% and 35.4%, respectively.
“The virus is just starting to spread in the United States, the market is going much lower!”
“A recession is imminent, stocks will get crushed, sell everything!”
“Stocks are going to crash when the initial jobless claims report is released!
There will be millions unemployed this week!“
In such a scary and pessimistic environment, you might have heard plenty of similar predictions over this past week. And indeed, the U.S. just surpassed China as the country with the most COVID-19 cases. A recession has most likely begun already and central banks around the world are trowing trillions to save the economy. Initial jobless claims came at 3.283 million yesterday, an all-time negative record.
Yet, against all logic and pessimism, the stock market went up. Both the S&P 500 and DJIA have been rising for three consecutive days. Yesterday, the indices actually crossed the 20% recovery mark from their respective Monday lows, technically re-entering bull market territory.
The Elliott Wave Logic Fueling the S&P 500 Recovery
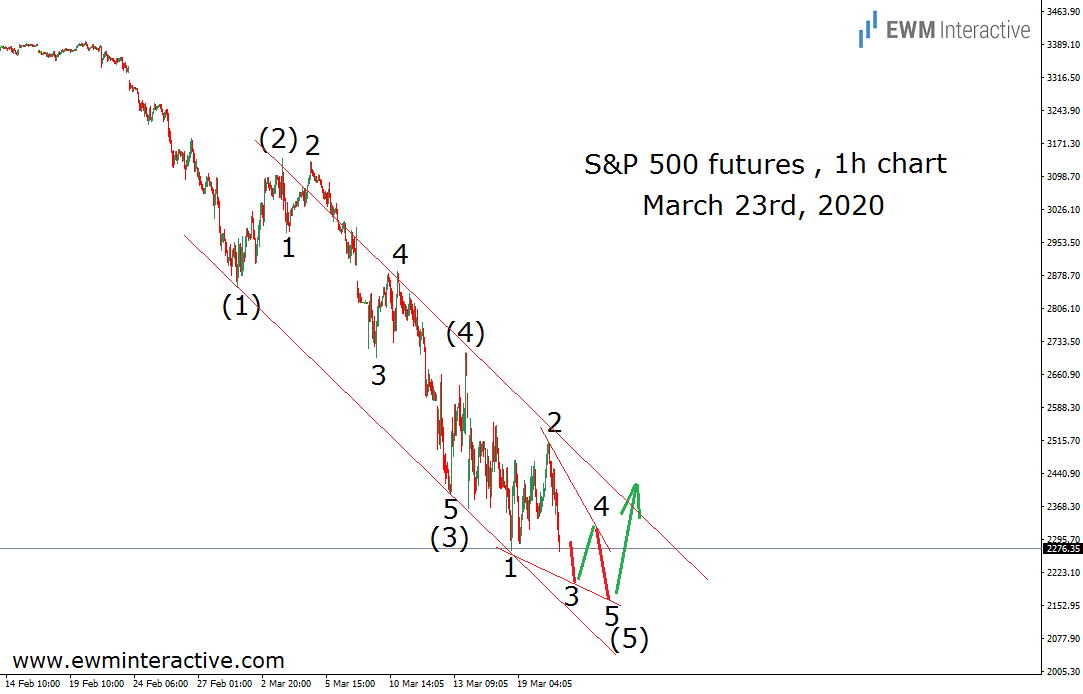
If you’re struggling to figure out why the market is up amid a wave of warranted pessimism, you are not alone. However, there was a way to anticipate this week’s bullish reversal. Our subscribers received the following chart before the open on Monday, March 23rd. It shows that in terms of Elliott Wave patterns, the sudden rebound makes a lot of sense.

The S&P 500’s hourly chart allowed us to take a look the structure of the selloff from 3394. It revealed an almost complete five-wave impulse pattern, which we labeled (1)-(2)-(3)-(4)-(5). The five sub-waves of wave (3) were also visible, while wave (5) seemed to be developing as an ending diagonal.
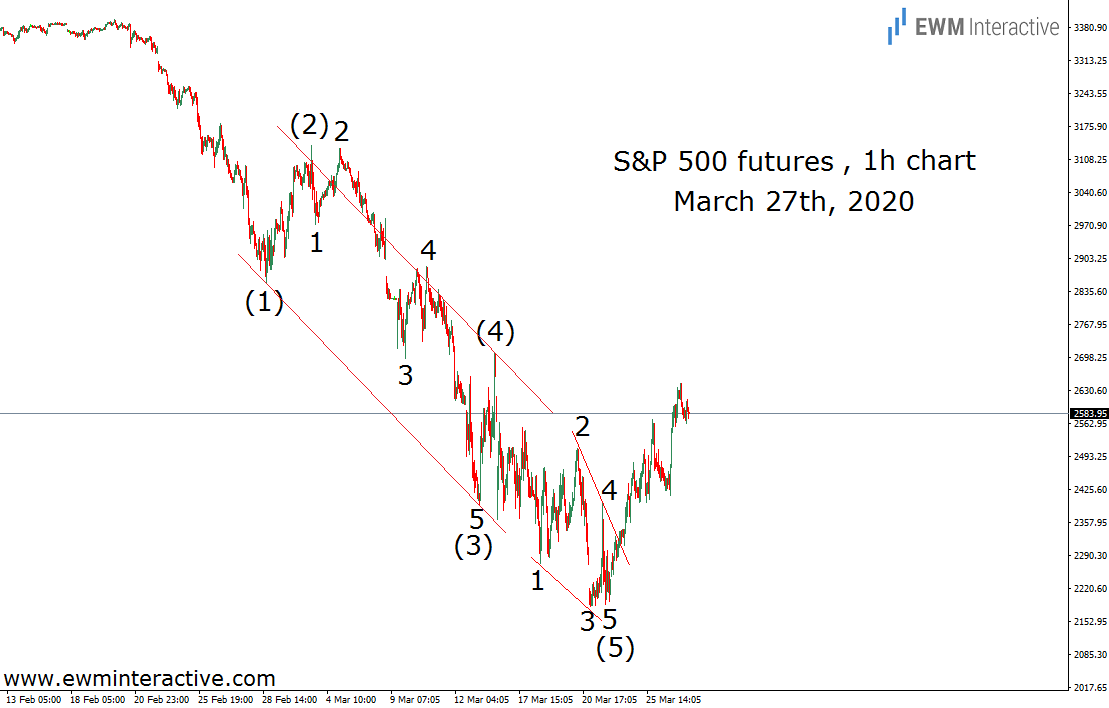
According to this count, a short-lived dip below 2200 in wave (5) was likely to be followed by a bullish reversal. Despite all the negative headlines, the market, for some reason, was signalling a recovery ahead. The updated chart below shows how things went.

The market opened with a downside gap on Monday. Shortly after that, wave 3 of (5) dragged the price to 2184. Wave 5 of (5) couldn’t even make a new low and ended up as a truncation. As of this writing, the S&P 500 futures trade near 2570, after exceeding 2640 earlier.
The market anticipates, it doesn’t follow. Its 20%+ recovery in the midst of an economic and health crisis is just another example. And while the news is always last to reflect trend reversals, an eye for Elliott Wave patterns can often put traders ahead of news and reversals alike.
