The bull market is in charge and holding court. Many believe that the latest charge has been going on since the cathartic sell off during the Financial Crisis that bottomed in 2009. Others will note that pullbacks in 2010 and 2011 entered bear territory and therefore the run started. And still others will point to the deep pullback into early 2016 with its long drawn out stagnant action as the start of the latest bull market leg. Which camp you fall into likely depends upon your time-frame. And frankly, it does not matter. The market is going up and fast.

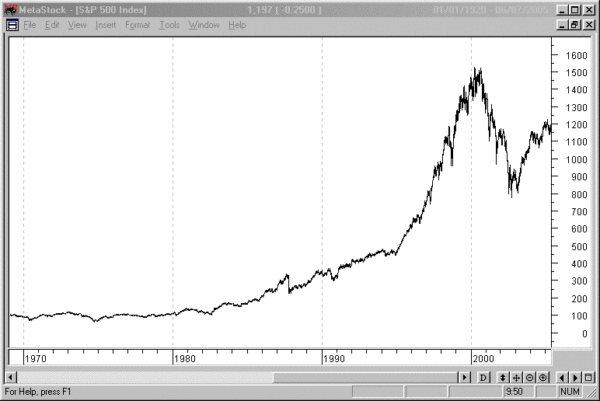
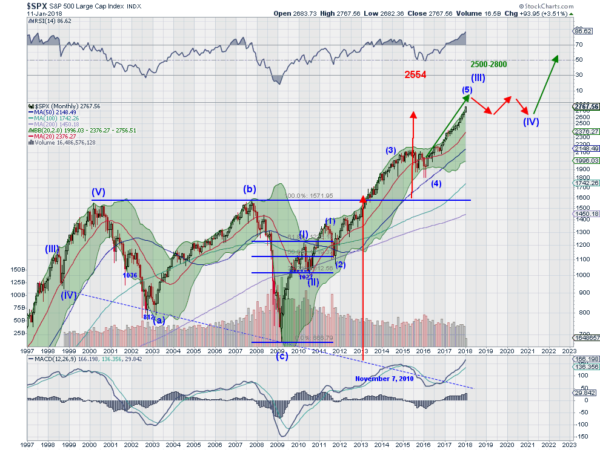
The S&P 500's long-term view gives some insight into this and a few possible thoughts on where the S&P 500 may be heading. The chart above shows the S&P 500 rising out of a long base in the 1970s to a top at 1500 at the height of the dot-com bubble. That's a long time ago but the impact might be important. The run up ended an Impulse Wave higher and preceded a protracted broad consolidation period. The chart below continues the picture, showing the consolidation and corrective action from 2000 to 2013.

The break out to the upside in 2013 was a major signal of bullishness after 13 years of stagnation. The move from the bottom in 2009 began a new Impulse Wave. The classical break of a wedge gave a target to 2554, and that has been left in the dust. Elliott Wave principles give a range of 2500 to 2800 as the end of Wave (III). This comes from extending Wave (1) and (3) to the bottom of Wave (4). But this range does not have to limit it. There really is no way to predict the final top, if there ever is one.
With the S&P deep within this range and above other measures, it warrants watching closely. Momentum is also running very hot. The RSI over 86 is higher than it has been in over 20 years. The same goes for the MACD. Momentum can always continue to get hotter, but this is also a sign that more time has run out of the bull than there may be left. This is where the doom and gloomers come in. The end of Wave (III) does not have to mean a deep pullback or correction or crash. Markets can correct through time as well as through a price drop.
Elliott Wave gives us a possible road map for the future. Often the two corrective moves in the Impulse Wave are opposite in nature. And with Wave (II) being a pullback of about 18%, Wave (IV) should be flatter, more of a sideways correction like the Wave (4) correction within Wave (III). The first one, Wave (II), lasted only 6 months. All this leave Wave (V) to continue to the upside. With a flat Wave (IV) a target range for Wave (V) would be 3200 to 3700.
Predicting the top of a run is a fools game, and many have joined the fools club over the past 8 years. I do not intend to be one of them. Follow the easier path to the upside until it ends. And continue to reassess along the way. If you are worried about pullbacks then add downside protection. That's what options are for.
