
Sony Corporation (NYSE:SNE) reported healthy third-quarter fiscal 2019 results, wherein adjusted earnings and revenues increased on a year-over-year basis.
Net Income
For the fiscal third quarter, Sony’s GAAP net income decreased 46.5% year over year to ¥229.5 billion or ¥182.89 per share ($2,109.3 million or $1.68 per share), primarily due to lower operating income and higher income tax. However, adjusted net income was ¥216.2 billion compared with ¥157.9 billion in the year-ago quarter.
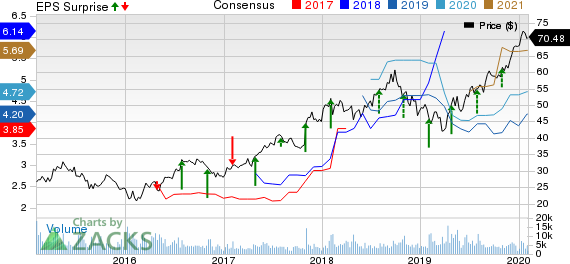
Sony Corporation Price, Consensus and EPS Surprise
Revenues
Quarterly aggregate operating revenues were up 2.6% year over year to ¥2,463.2 billion ($22,639.3 million). This reflects significant increase in Financial Services and Imaging & Sensing Solutions (I&SS) segment sales, and decrease in Game & Network Services (G&NS) segment sales.
Segment Results
Sales at G&NS declined 20% year over year to ¥632.1 billion due to decrease in PlayStation4 (PS4) hardware unit sales, decline in sales of non-first-party software titles, and negative impact of foreign exchange rates. The segment’s operating income was ¥53.5 billion compared with ¥73.1 billion in the prior-year quarter.
Sales at Music grew 3.6% to ¥216.9 billion led by higher sales for Music Publishing resulting from the consolidation of EMI, and higher sales for Recorded Music attributable to an increase in streaming revenues. The unit’s operating income was ¥36.3 billion, which declined from ¥147.1 billion in the prior-year quarter, due to a remeasurement gain of ¥116.9 billion resulting from the consolidation of EMI in third-quarter fiscal 2018.
Sales from Pictures decreased 14.7% to ¥236 billion due to lower revenues for Motion Pictures and lower sales for Media Networks owing to the impact of the channel portfolio review. The segment’s operating income was ¥5.4 billion compared with ¥11.6 billion in the prior-year quarter.
Electronics Products & Solutions (EP&S) sales came in at ¥650.4 billion, down 8.8% on a year-over-year basis. This was due to decrease in unit sales of smartphones and televisions, and impact of foreign exchange rates. However, the segment’s operating income improved to ¥80.3 billion from ¥66.2 billion in the year-ago quarter, backed by reduction in operating costs mainly within Mobile Communications.
Sales at I&SS were up 29.4% to ¥298 billion driven by significant increase in sales of image sensors for mobile products. The segment’s operating income was ¥75.2 billion compared with ¥46.5 billion in the prior-year quarter.
Financial Services sales were up 148.9% to ¥407.2 billion supported by significant increase in revenue at Sony Life. The segment’s operating income was ¥32.6 billion compared with ¥37.9 billion a year ago, implying net losses related to market fluctuations.
Sales from All Other were down 28.7% to ¥72.3 billion. Operating income was ¥20.7 billion compared with ¥6.1 billion in the prior-year quarter.
Other Details
Total expenses were ¥2,165.7 billion, up 7.1% year over year, primarily due to higher cost of sales and SG&A expenses. Overall operating income was ¥300.1 billion, down 20.4%, owing to significant decrease in operating income in the Music segment and G&NS segment.
Cash Flow & Liquidity
During the first nine months of fiscal 2019, Sony generated ¥901.4 billion of net cash from operating activities compared with ¥834.1 billion in the year-ago period. As of Dec 31, 2019, the electronics and media company had ¥1,408.9 billion ($12,967.5 million) in cash and equivalents with ¥631.7 billion ($5,814.2 million) of long-term debt.
FY19 Outlook Raised
The Japanese firm has raised its forecast, which was announced on Oct 30, 2019, for consolidated results for the fiscal ending Mar 31, 2020. It now expects operating revenues to be ¥8,500 billion, up from the previous guidance of ¥8,400 billion. This indicates higher-than-expected sales primarily in the Financial Services and I&SS segments.
Operating income is estimated to be ¥880 billion, up from the prior guidance of ¥840 billion. This can be attributed to an increase in operating income primarily in the I&SS segment as well as an expected decrease in operating loss in All Other. Income before income taxes is expected to be ¥860 billion, up from the previous guidance of ¥800 billion. Sony anticipates net income to be ¥590 billion, up from previously forecasted ¥540 billion.
Zacks Rank & Other Stocks to Consider
Sony currently has a Zacks Rank #1 (Strong Buy) and a VGM Score of A.
A few other top-ranked stocks in the broader industry are The Walt Disney Company (NYSE:DIS) , GoPro, Inc. (NASDAQ:GPRO) and Trip.com Group Limited (NASDAQ:TCOM) , each carrying a Zacks Rank #2 (Buy). You can see the complete list of today’s Zacks #1 Rank stocks here.
Walt Disney topped earnings estimates thrice in the trailing four quarters, the positive surprise being 2%, on average.
GoPro surpassed earnings estimates thrice in the trailing four quarters, the positive surprise being 6.3%, on average.
Trip.com surpassed earnings estimates in the trailing four quarters, the beat being 136.8%, on average.
Conversion rate used:
¥1 = $0.009197 (period average from Oct 1, 2019 to Dec 31, 2019)
¥1 = $0.009204 (as of Dec 31, 2019)
7 Best Stocks for the Next 30 Days
Just released: Experts distill 7 elite stocks from the current list of 220 Zacks Rank #1 Strong Buys. They deem these tickers “Most Likely for Early Price Pops.”
Since 1988, the full list has beaten the market more than 2X over with an average gain of +24.7% per year. So be sure to give these hand-picked 7 your immediate attention.
See 7 handpicked stocks now >>
The Walt Disney Company (DIS): Free Stock Analysis Report
Sony Corporation (SNE): Free Stock Analysis Report
GoPro, Inc. (GPRO): Free Stock Analysis Report
Ctrip.com International, Ltd. (TCOM): Free Stock Analysis Report
Original post
Zacks Investment Research