Post-February 9 reversal, both the Nasdaq composite and the Nasdaq 100 index went on to surpass the late January highs. Other indices such as the S&P 500 large cap index and the Dow Industrials could not match that feat. The Russell 2000 small cap index came close on March 13 as it came within less than seven points of surpassing the all-time high of January 24. In that same session, the Nasdaq composite and the Nasdaq 100 rallied to a new high, but only to reverse hard.
Throughout this latest surge by the tech-heavy indices, the knock against the rally was that the advance was narrow.
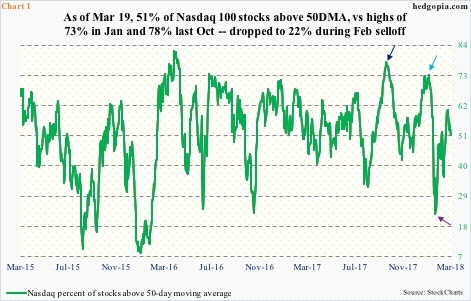
On February 8, a mere 22.5 percent of Nasdaq stocks were above their 50-day moving average (indigo arrow in Chart 1). The index bottomed the next day. By the 12th this month, this metric rose to just north of 60 percent – looks fine on the surface, but this was much lower than what it was in January, and even last October.
The soldiers are not moving hand in hand with the generals. Some chinks in tech’s armor are showing up. Of the large names, Alphabet (NASDAQ:GOOGL) has lost the 50-day. Ditto with Facebook (NASDAQ:FB), which also closed Monday right on the 200-day. Apple (NASDAQ:AAPL) and Microsoft (NASDAQ:MSFT) are approaching the 50-day, while Amazon (NASDAQ:AMZN) is comfortably above it.
In recent months, tech likely also benefited from short squeeze.
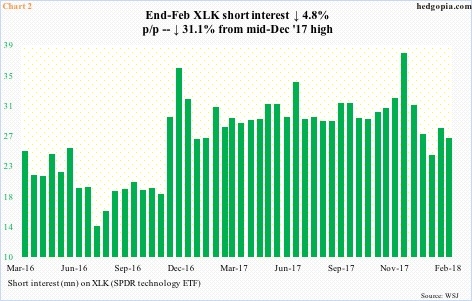
Post-US presidential election in November 2016, short interest on Technology Select Sector SPDR (NYSE:XLK) jumped. Tech rallied big, particularly last year, but these shorts – although hurting – stayed put, and probably got squeezed along the way. As of the end of February, short interest is down 31 percent from the mid-December high last year (Chart 2).
If for example recent price action in the Nasdaq 100 is any sign, shorts can breathe a sigh of relief – duration and magnitude notwithstanding.
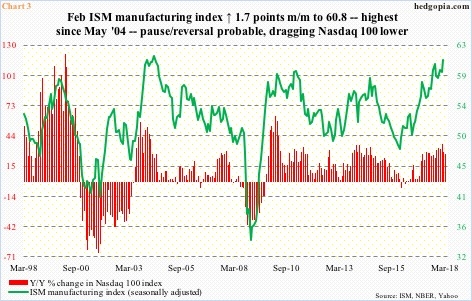
Chart 3 plots the ISM manufacturing index with year-over-year change in the Nasdaq 100. The two tend to move in tandem.
In February, the manufacturing index rose 1.7 points month-over-month to 60.8. This was the highest since 61.4 in May 2004. Historically, it is rare for manufacturing to persistently stay in the 60s before weakening. In fact, since the low in August 2016, the index has gone up 10.9 points. Manufacturing activity is very strong, and is likely to at least take a breather. In this scenario, the Nasdaq 100 should follow.
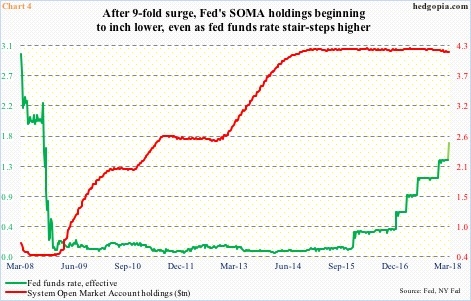
It is too soon to say how what is going on in Chart 4 will reverberate through stocks, but in all probability is not a positive.
The FOMC meets later today. Markets expect a 25-basis-point increase tomorrow, which is represented by the light green vertical line on the right side of the chart. From December 2015 when the Fed started raising the fed funds rate after keeping it near zero for seven long years, rates would have gone up by 150 basis points – still historically low, but with an upward bias.
Concurrently, the fed is also reducing its mammoth balance sheet. SOMA (System Open Market Account) holdings were less than $500 billion before the first iteration of quantitative easing began in November 2008. When the bank decided to pare it back last October, these assets were north of $4.2 trillion. As of last Wednesday, this stood at $4.18 trillion.
As the red line continues lower and in due course picks up speed, stocks can suffer. If Chart 4 indeed becomes a factor, the risk is more medium- to long-term.
Right here and now, the benefit of the doubt does rest with the bears.
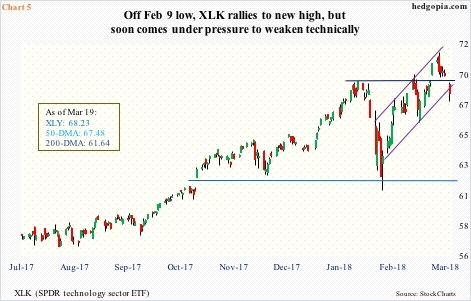
On XLK ($68.23), the daily chart just developed a potentially bearish MACD cross-under, with a little divergence to boot. Between January 26 and March 13, the ETF made higher highs (Chart 5), but the daily RSI made lower highs. Monday was a large gap down.
In essence, the breakout seven sessions ago has so far been proven false. The March 13 high itself came in an outside day session, which was preceded by a doji. Both the 10- and 20-day have been lost, although the 50-day is intact.
In a time like this, at least a credit call spread makes sense.
Hypothetically, going out nearly three weeks to April 6, XLK 69 and 70 calls are selling for $0.81 and $0.40. A bear call spread – short 69, long 70 – earns $0.41 in premium; $0.59 is at risk. The position starts bleeding if the underlying rallies past $69.41. Technical resistance on the underlying lies at $69 and change.
Thanks for reading!

