Unlike the stock market, where a profitable company with a growing market share will eventually grow in value in the long-term, the Forex market can be a real riddle. Macroeconomic, political and country-specific factors are fighting for influence over currency rates in the $5-trillion-a-day market. USD/JPY is one of the most closely followed pairs as it pitches the currencies of the first and the third biggest economies in the world against one another.
USD/JPY was a disappointment for the bulls last week. After opening at 112.54, the pair fell to as low as 111.38 before closing at 111.89 on Friday. A week earlier, it reached 112.89, following a recovery from 111.62. The ongoing trade war between the U.S. and China as well as the sharp declines in major stock markets around the world are among the usual reasons the financial media explains everything with these days, including USD/JPY’s behavior.
We take a different approach, which allows us to anticipate future price swings, instead of just explaining them after the fact. It is called Elliott Wave analysis and it put us several days ahead of USD/JPY’s recent developments. Here is how.
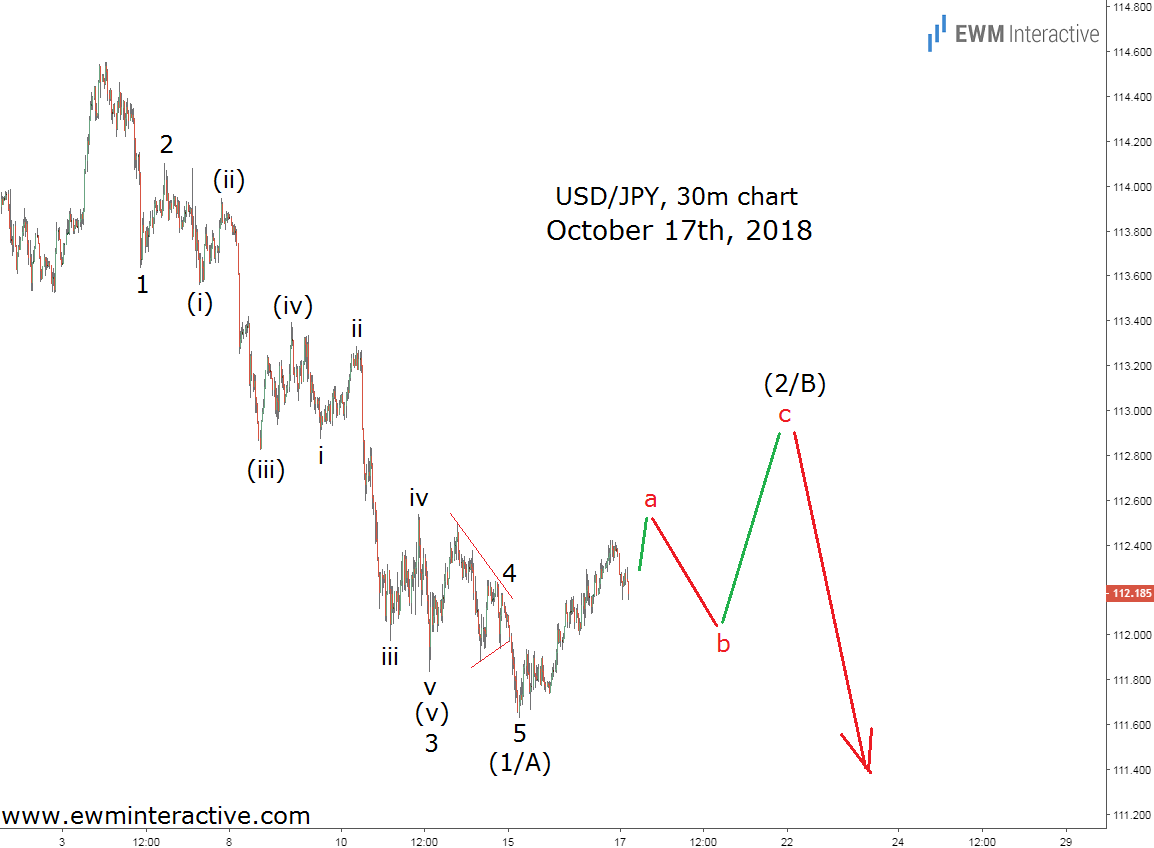
This chart, sent to subscribers as a Wednesday update on October 17th, allowed us to identify a textbook five-wave impulse to the south between 114.55 and 111.62. It is labeled 1-2-3-4-5 in wave (1/A), where the sub-waves of wave 3 and wave (v) of 3 are also clearly visible. Wave 4 was a contracting triangle.
According to the Elliott Wave theory, impulses point in the direction in which the larger sequence is moving, but are followed by a three-wave correction in the opposite direction first.
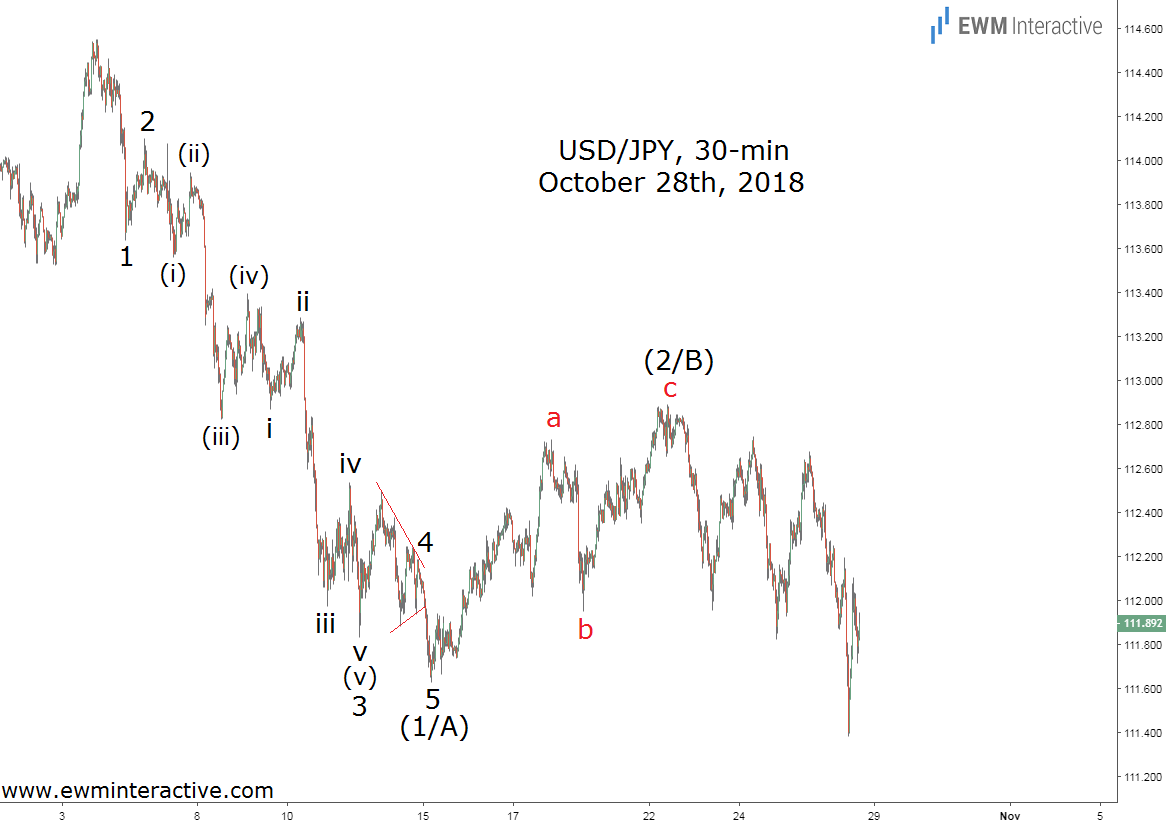
In other words, a recovery to roughly 113.00 in wave (2/B) was supposed to occur, before the bears return to drag USD/JPY to a new low in wave (3/C). The updated chart below show what happened next.
USD/JPY climbed to 112.89 in wave “c” of (2/B) on October 22nd. From then on, the pair started making lower lows and lower highs until it breached the bottom of wave (1/A) and fell to 111.38 on October 26th.
Elliott Wave analysis removes the need most traders have, namely to constantly follow external factors such as political and economic news and events. The Forex market really is a riddle, but you can still solve it and get the reward, if you know what to look for.
