Get 40% Off
🚨 Volatile Markets? Find Hidden Gems for Serious OutperformanceFind Stocks Now

Small Caps Still Most Under Pressure From Sellers

Published 04/02/2020, 01:05 AM
Updated 07/09/2023, 06:31 AM

With a new month we have a fresh review of the monthly investor watch signals. The tables at the very end of this article show the current relationship of the indices to their 200-day MA. The S&P and NASDAQ are still in the 10% zone of historic weak action; the latter back to 1950, the former to 1971. The Russell 2000 is still well inside the 1% of historic weak action and yesterday's action confirmed this.

The Russell 2000 (via iShares Russell 2000 ETF (NYSE:IWM)) took a near 7% loss and gapped down from its swing high; this gap—if it becomes a true breakdown gap—cannot close, so it does establish a risk:reward marker for shorts to work with and  a resistance line to define a sequence of higher highs when this turns into a bull market.

The question now is whether it will test the March swing low or make a new higher low? To add to the misery, selling volume increased as new distribution was registered—again, one which points in favor of short trades.
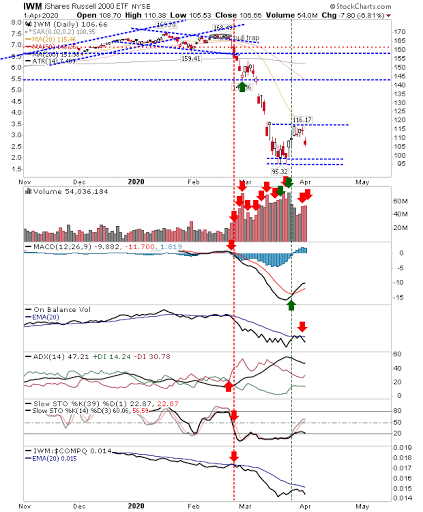
IWM Daily Chart

The S&P also flagged a gap down as we establish the range bounds for either a new higher or a new lower low. On-Balance-Volume, ADX and Stochastics all favor bears while the MACD sides with the bulls.
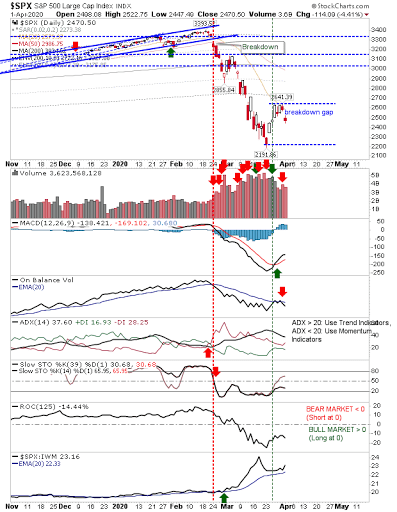
SPX Daily Chart

Similarly, the NASDAQ also has the rangebound support and resistance levels to work with; again, a bull market on a break above resistance and a continuation of the bear market on a loss of support. 
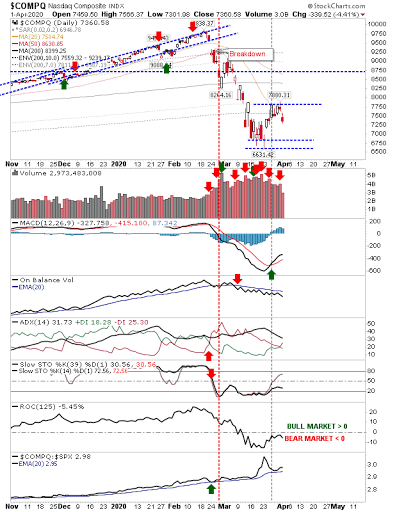
COMPQ Daily Chart

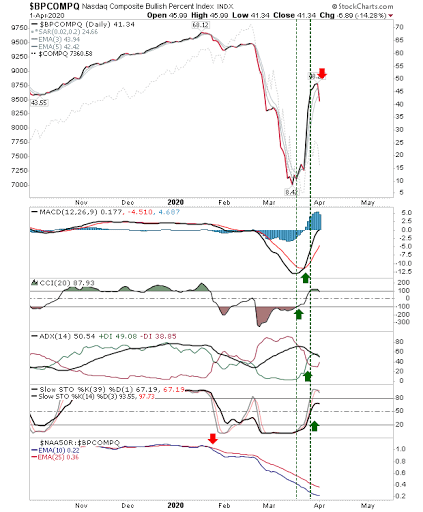
The Bullish Percents have also signaled a top at the 50% boundary. But, unlike the index, supporting technicals are bullish.
3rd party Ad. Not an offer or recommendation by Investing.com. See disclosure here or remove ads .

BPCOMPQ Daily Chart

Going forward, we have the initial basis for a higher high and higher low sequence or can continue its descent into a retest of lows (and maybe worse).
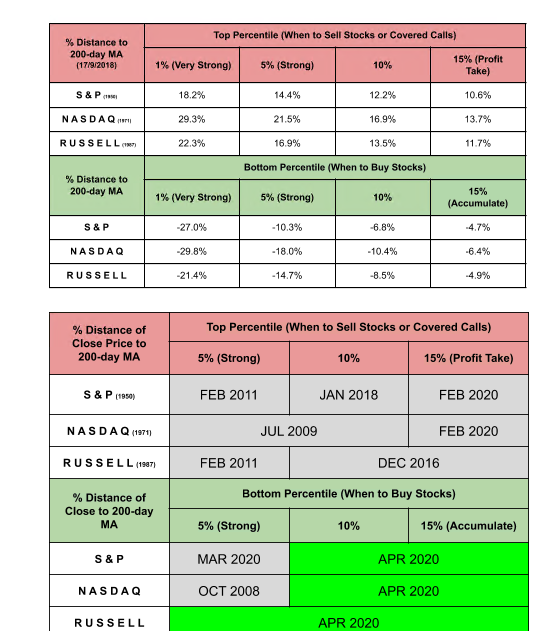
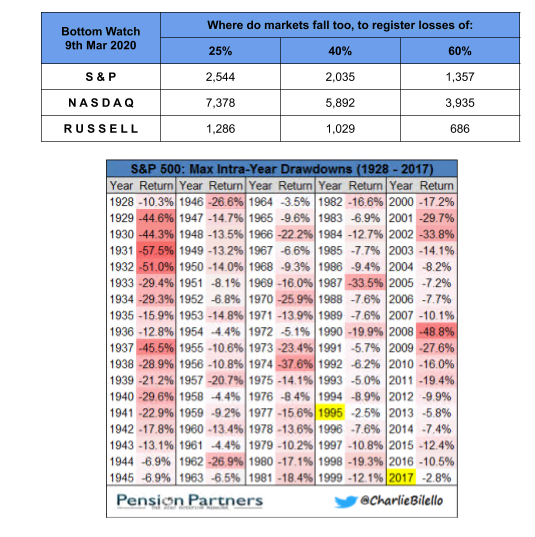
When to Buy/Sell Stocks or Covered Calls

Bottom Watch and Drawdowns

Latest comments

Risk Disclosure: Trading in financial instruments and/or cryptocurrencies involves high risks including the risk of losing some, or all, of your investment amount, and may not be suitable for all investors. Prices of cryptocurrencies are extremely volatile and may be affected by external factors such as financial, regulatory or political events. Trading on margin increases the financial risks.
Before deciding to trade in financial instrument or cryptocurrencies you should be fully informed of the risks and costs associated with trading the financial markets, carefully consider your investment objectives, level of experience, and risk appetite, and seek professional advice where needed.
Fusion Media would like to remind you that the data contained in this website is not necessarily real-time nor accurate. The data and prices on the website are not necessarily provided by any market or exchange, but may be provided by market makers, and so prices may not be accurate and may differ from the actual price at any given market, meaning prices are indicative and not appropriate for trading purposes. Fusion Media and any provider of the data contained in this website will not accept liability for any loss or damage as a result of your trading, or your reliance on the information contained within this website.
It is prohibited to use, store, reproduce, display, modify, transmit or distribute the data contained in this website without the explicit prior written permission of Fusion Media and/or the data provider. All intellectual property rights are reserved by the providers and/or the exchange providing the data contained in this website.
Fusion Media may be compensated by the advertisers that appear on the website, based on your interaction with the advertisements or advertisers.
© 2007-2024 - Fusion Media Limited. All Rights Reserved.