Stretched-Weakness
iShares Russell 2000 (NYSE:IWM) had a great month in early November as it shot up from 114ish to 139ish just in about a month- that's whopping 20% gain in total value in one month! That's impressive.
Well, last few weeks we are seeing a slow-down here as the index is starting to fizzle back and forth as it has gotten into an 'overbought' territory.
So the question is, would we see a huge dive here or are we going to consolidate before making another leg higher?
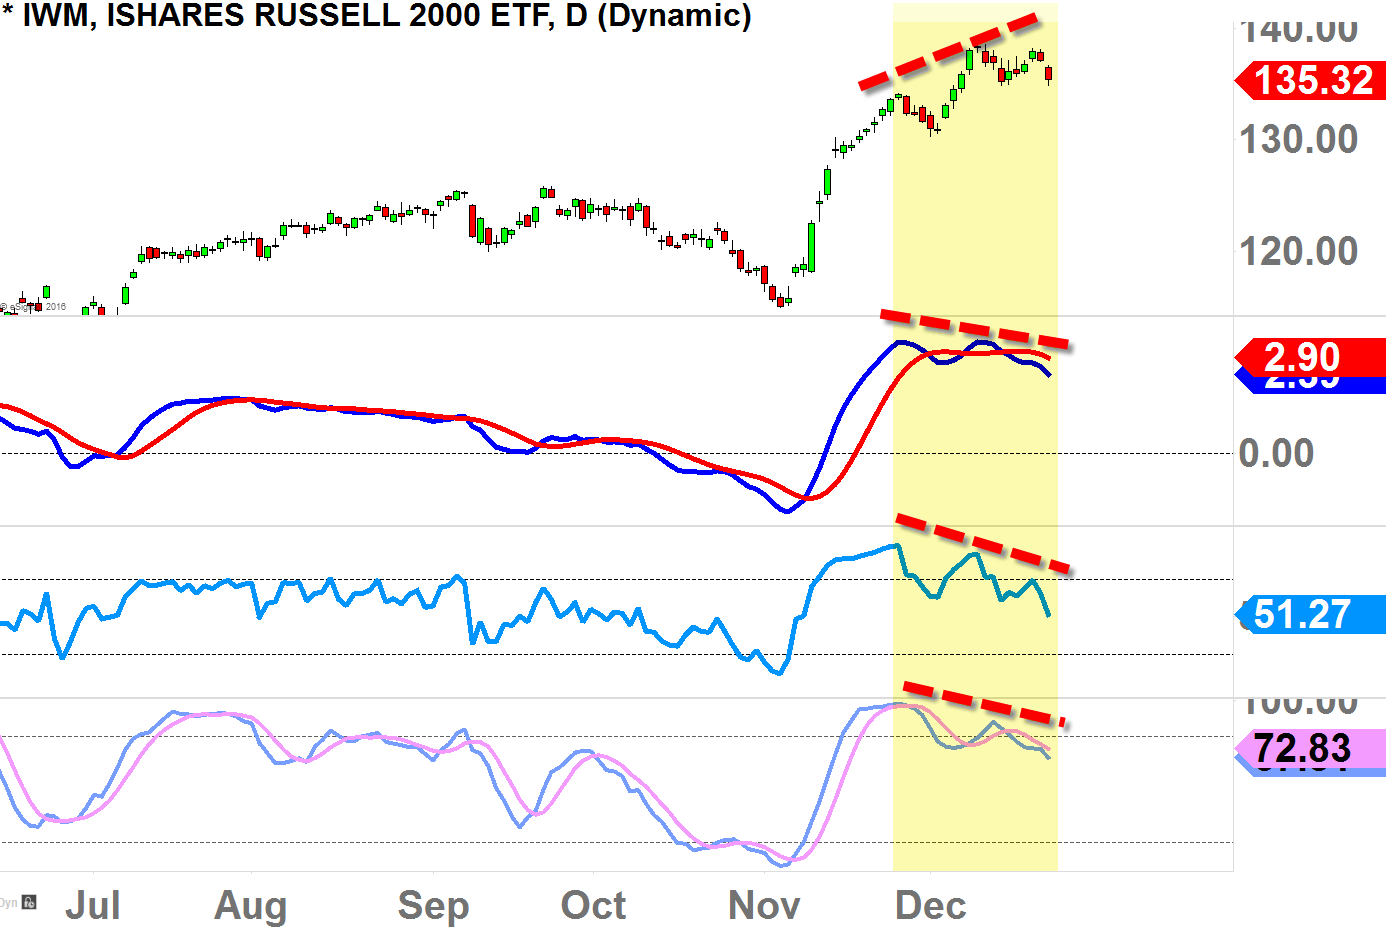
Below is the daily-chart of Russell 2000 ETF (IWM), and as you can see we are seeing bearish divergence price-action since late-November.
This divergence typically occurs when the price is stretched, yet it moves higher while the momentum weakens, hence the oscillators creating lower highs while the price-action establishes higher high.
This is minor- to intermediate-term bearish signal as long as oscillators continue to slope downward.
And, yes, this signal has the potential to bring this thing down hard, but the problem is we are seeing this divergence occurring only on IWM (not on SPDR Dow Jones Industrial Average (NYSE:DIA), SPY (NYSE:SPY), PowerShares QQQ Trust Series 1 (NASDAQ:QQQ), though XLF is pretty stretched with some divergence) as of today.
So if the other indices start to move higher, we may see IWM kind of fizzles up and down but we won't see much of strength to the upside because of this bearish divergence.
Let's look at next levels of support.

Current Support
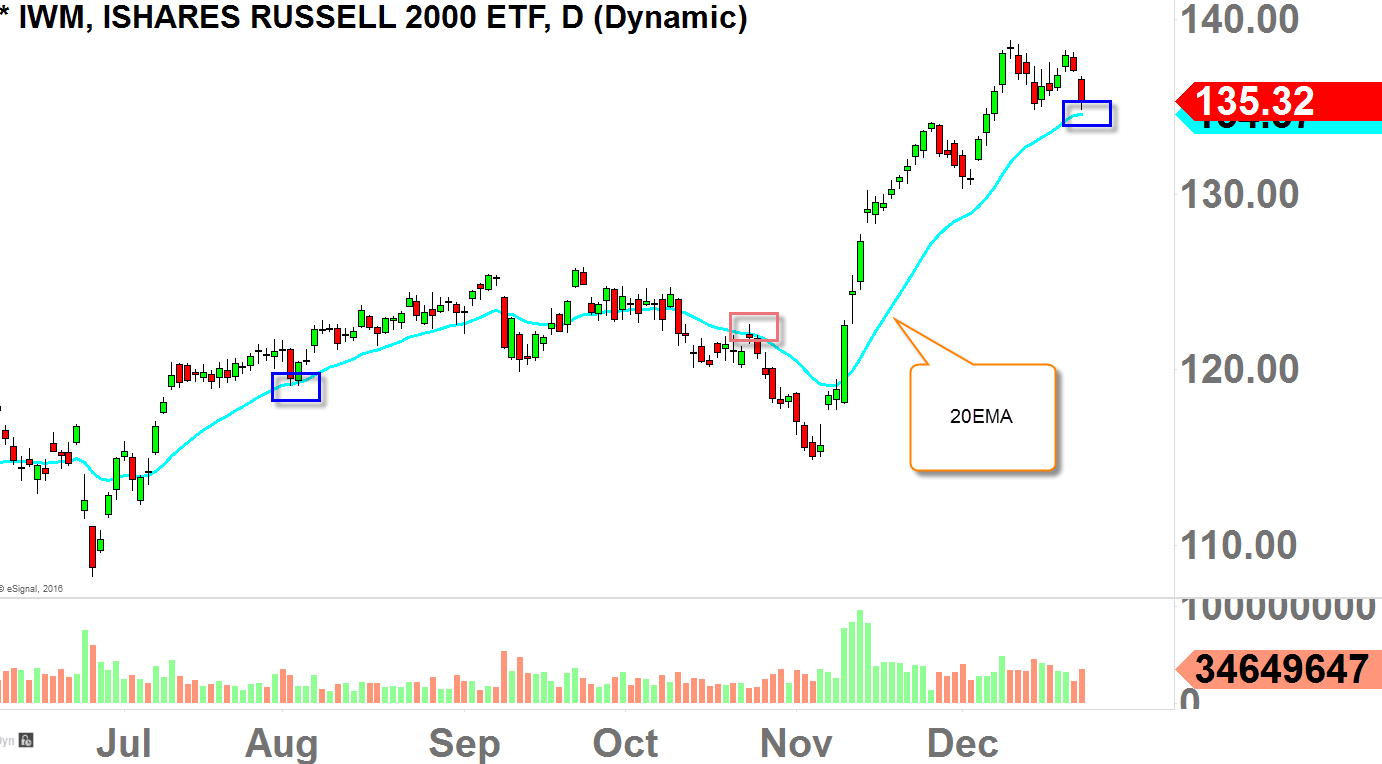
IWM is currently trading right above the "20EMA," and as long as it stays above this level, short-term dip-buyers might show up to bring the price back up to about 138-139.
So if you are a bear, you want to see the price closing well below this level for further decline, because as you can see back in August, it found support at 20EMA and ran for another month before pulling back again.
But if the bulls are not able to protect "20EMA", next level of support is 50EMA.

Next Support
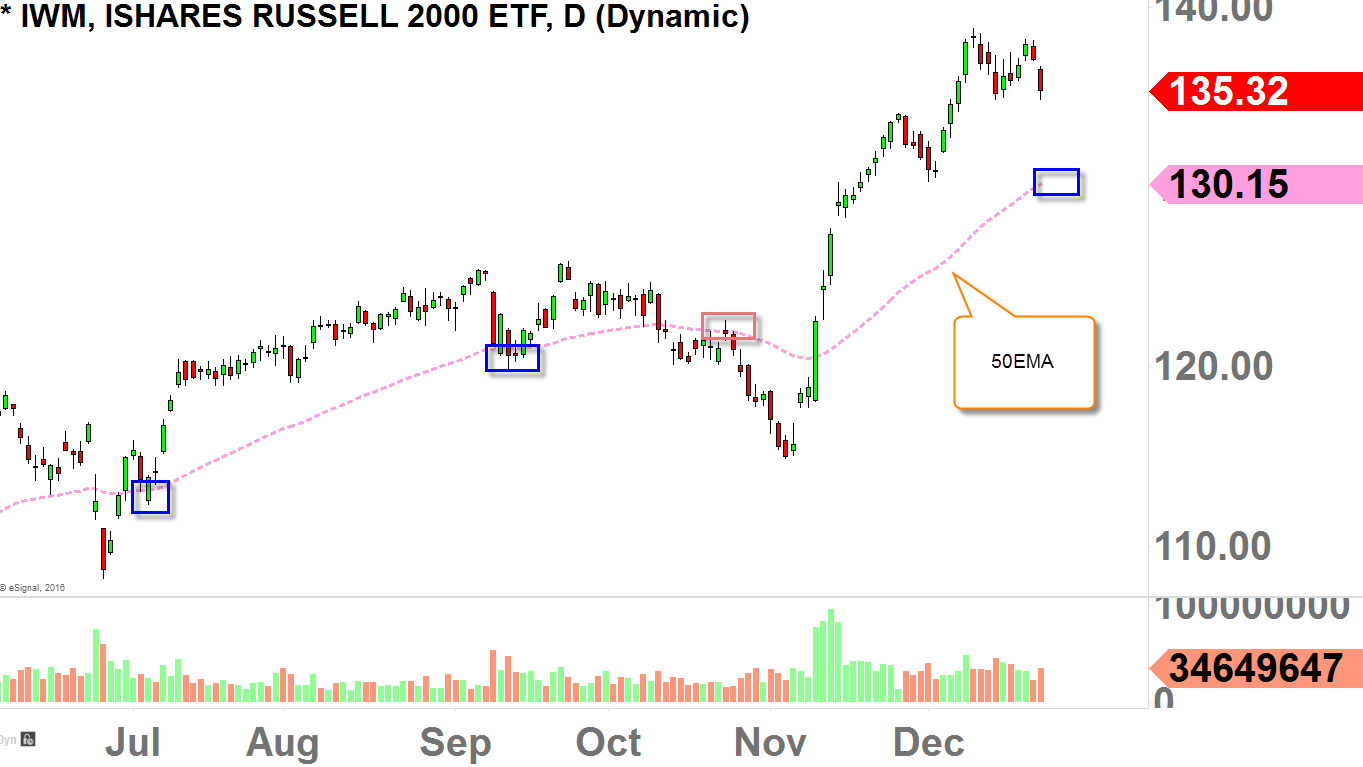
Here is the "50EMA" chart and this 50EMA has the impressive resume as it has been acting as strong pivot since July.
July acted as support, Mid-September acted as support, and in late-October it acted as strong resistance.
So if or when the price slides down to the "50EMA" level (currently residing at 130ish), I do believe it will act as pretty strong support.
Also keep in mind, in 131-level we do have the gap that is open, so in 131-level, we have 50EMA and gap support which that will make this level strong level for a bounce.
 Disclosure: I currently do not have position on IWM at the time of this article
