
SM Energy Company (NYSE:SM) recently reported second-quarter 2019 adjusted earnings of 2 cents per share against the Zacks Consensus Estimate of a loss of 11 cents. The reported figure, however, decreased from earnings of 15 cents a year ago.
Total revenues, which declined to $407.2 million from $443.9 million in the prior-year quarter, marginally missed the Zacks Consensus Estimate of $408 million.
The better-than-expected second-quarter 2019 earnings were supported by higher production levels and increased operating efficiency. However, the positives were partially offset by lower commodity price realizations.
SM Energy Company Price, Consensus and EPS Surprise
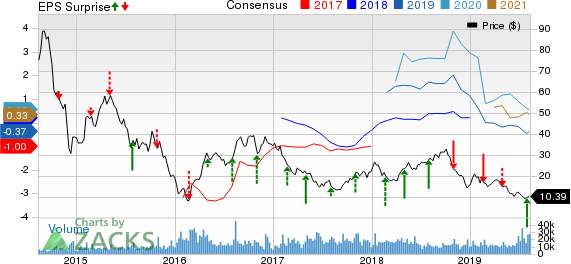
SM Energy Company price-consensus-eps-surprise-chart | SM Energy Company Quote
Operational Performance:
Production Surges
The company’s second-quarter production was 136.5 thousand barrels of oil equivalent per day (MBoe/d), up 19% from the year-ago level of 115.2 MBoe/d.
Oil production increased 24% year over year to 59.6 thousand barrels per day (MBbls/d). SM Energy produced 310.9 million cubic feet per day of natural gas in the quarter, up 12% year over year. Natural gas liquids contributed 25.1 MBbls/d to total production volume, up 20% from the second-quarter 2018 level.
Realized Prices Decline
Due to hedging, the average price per Boe was $33.07 (including the effects of derivative settlements) compared with $34.91 in the year-ago quarter. Including hedging activities, average realized price of natural gas fell 24% year over year to $2.51 per thousand cubic feet. Moreover, average realized prices of oil fell 2% to $54.07 per barrel and that of natural gas liquids declined 5% from the prior-year quarter to $20.42.
Cost & Expenses
On the cost front, unit lease operating expenses decreased 11% year over year to $4.16 per Boe, reflecting significant increase in efficiency. In addition, transportation expenses fell to $4 per Boe from $4.47 in the year-ago quarter. General and administrative expenses also decreased 10% to $2.49 per Boe from the prior-year level of $2.76. However, depletion, depreciation and amortization expenses were up 15% to $16.61 per Boe from the year-ago level of $14.48.
Total exploration expenses fell to $10.9 million from $14.1 million in the year-ago quarter. Hydrocarbon production expenses in the quarter were recorded at $123.1 million compared with the year-ago level of $117.4 million. Total operating expenses in the quarter declined to $303 million from the year-ago period’s $387.8 million, primarily due to a net derivative gain.
Balance Sheet
As of Jun 30, SM Energy had a cash balance of $12 thousand and long-term debt of $2,721.2 million. The company had a debt-to-capitalization ratio of 49.3%.
Guidance
SM Energy expects full-year 2019 production to average 129-131 MBoe/d. Production for third-quarter 2019 is projected within 12-12.2 million barrels of oil equivalent or 130-133 MBoe/d, of which 43% is expected to be oil. For second-half 2019, the company expects capital program of around $70-80 million per month. Full-year lease operating expense is expected to be $5 per Boe. In 2019, the company expects to achieve production growth, while keeping capital expenditure low.
Zacks Rank and Stocks to Consider
Currently, SM Energy has a Zacks Rank #3 (Hold). Some better-ranked stocks in the energy sector are given below:
Transportadora de Gas del Sur S.A. (NYSE:TGS) is a midstream energy firm. In the trailing four quarters, the company delivered average positive earnings surprise of 114%. It has a Zacks Rank #1 (Strong Buy). You can see the complete list of today’s Zacks #1 Rank stocks here.
Lonestar Resources US Inc. (NASDAQ:LONE) is an oil and gas exploration and production company. In the trailing four quarters, the company missed earnings estimates only once and delivered average positive surprise of almost 52%. The company has a Zacks Rank #2 (Buy).
Keane Group, Inc. (NYSE:FRAC) is a provider of integrated well completion services, primarily in the United States. In the trailing four quarters, the company delivered average positive surprise of 320.2%. It has a Zacks Rank #2.
Today's Best Stocks from Zacks
Would you like to see the updated picks from our best market-beating strategies? From 2017 through 2018, while the S&P 500 gained +15.8%, five of our screens returned +38.0%, +61.3%, +61.6%, +68.1%, and +98.3%.
This outperformance has not just been a recent phenomenon. From 2000 – 2018, while the S&P averaged +4.8% per year, our top strategies averaged up to +56.2% per year.
See their latest picks free >>
Transportadora De Gas Sa Ord B (TGS): Free Stock Analysis Report
SM Energy Company (SM): Free Stock Analysis Report
Lonestar Resources US Inc. (LONE): Free Stock Analysis Report
Keane Group, Inc. (FRAC): Free Stock Analysis Report
Original post