
Independent oil and gas company SM Energy Company (NYSE:SM) posted second-quarter 2016 adjusted loss of 44 cents per share. The quarterly loss was significantly narrower than the Zacks Consensus Estimate of a loss of 69 cents per share. The company had posted earnings of 49 cents per share in the year-ago quarter.
Total revenue was $341.8 million in the quarter, down 33.8% from $516 million in the prior-year quarter. Revenues, however, beat the Zacks Consensus Estimate of $323 million.
Operational Performance
The company’s second-quarter production came in at 157.2 thousand barrels of oil equivalent per day (MBoe/d), down 13% from the year-ago level of 181 MBoe/d. The decline was mainly attributable to termination of completion activity in the Eagle Ford shale.
SM Energy produced 428.2 million cubic feet per day (MMcf/d) of natural gas in the quarter, down 12% year over year. Oil production also decreased 19% year over year to 45.1 thousand barrels per day (MBbls/d). Natural gas liquids contributed 40.8 MBbls/d to the total volume, down 8% from the second quarter of 2015.
Including the effect of hedging, the average equivalent price per barrel of oil equivalent (Boe) was $27.45 compared with $33.63 in the year-ago quarter. Including hedging activities, the average realized price of natural gas plunged 24% year over year to $2.60 per thousand cubic feet (Mcf), average realized prices of oil declined 14% to $56.97 per barrel, and average realized prices of natural gas liquid decreased 7% to $15.61 per barrel.
SM ENERGY CO Price, Consensus and EPS Surprise
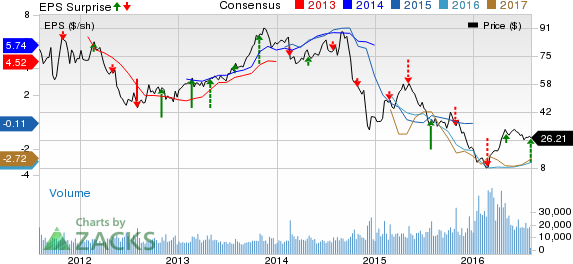
SM ENERGY CO Price, Consensus and EPS Surprise | SM ENERGY CO Quote
On the cost front, unit lease operating expenses (LOE) increased 2% year over year to $3.31 per Boe in the quarter. Transportation expenses increased marginally to $5.91 per Boe from $5.64 per Boe in the year-ago period. General and administrative expenses were down 29% to $1.60 per Boe from the prior-year level of $2.26 Boe, while depletion, depreciation and amortization (DD&A) expenses were up 11% to $14.75 per Boe from the year-ago level of $13.34 per Boe.
Liquidity
Net cash from operating activities decreased to $138.6 million during the quarter. The company had generated $265.6 million in the year-ago quarter. As of Jun 30, 2016, SM Energy had a cash balance of $0.02 million and long-term debt of $3,374.8 million, with a debt-to-capitalization ratio of 71.4% as against 65.2% in the prior-year quarter.
Guidance
SM Energy estimates production for 2016 in the range of 53–57 MMBoe/d. Production for the third quarter is projected between 13.5 MMBoe/d and 14.0 MMBoe/d.
The estimated LOE per Boe is within $3.90–$4.30. The company has set its capital expenditure budget for 2016 at $670 million.
Zacks Rank
SM Energy currently holds a Zacks Rank #2 (Buy). Other well-ranked stocks in the oil and gas sector include GeoPark Limited (NYSE:GPRK) , Sasol Ltd. (NYSE:SSL) and North Atlantic Drilling Limited (NYSE:NADL) . All these sport a Zacks Rank #1 (Strong Buy).
SASOL LTD -ADR (SSL): Free Stock Analysis Report
SM ENERGY CO (SM): Free Stock Analysis Report
GEOPARK LTD (GPRK): Free Stock Analysis Report
NORTH ATL DRILG (NADL): Free Stock Analysis Report
Original post
Zacks Investment Research