From Silver Doctors: In November of 2015 when silver was bottoming, we all had to endure 15 consecutive days of pure disgust.
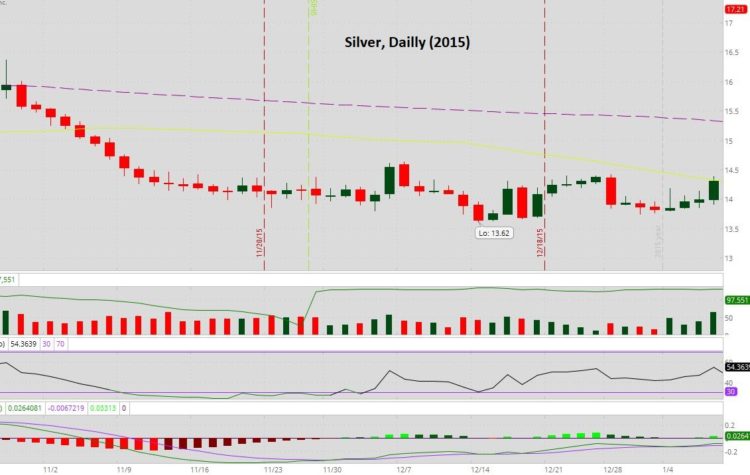
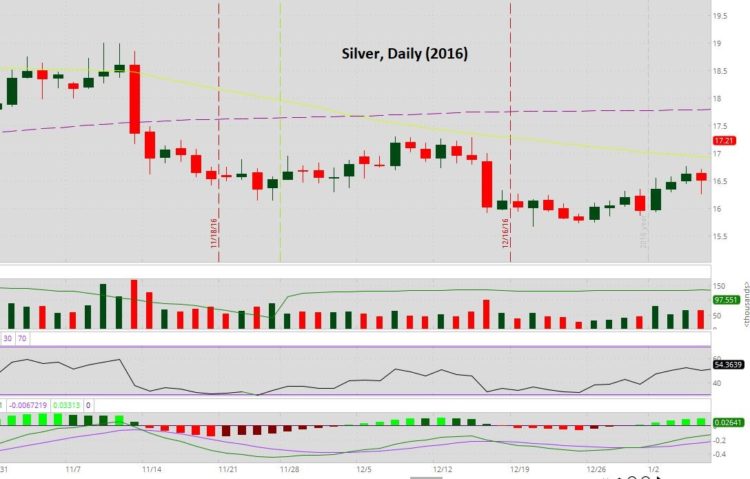
2016 was not quite as bad, but not any easier:
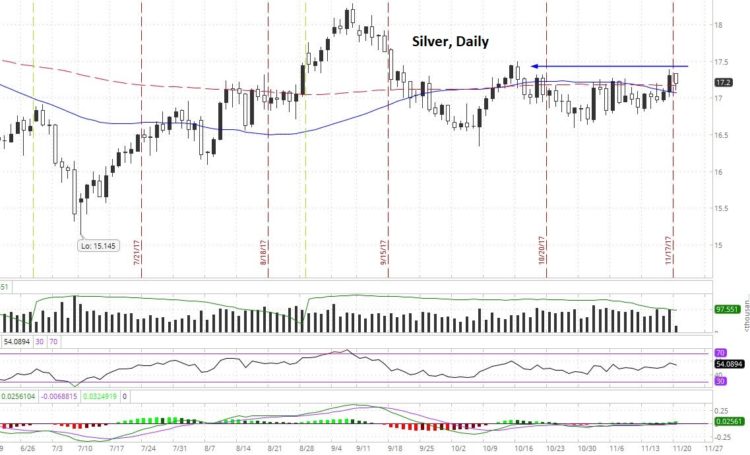
Which brings us to November 2017:
Notice the theme here.
Silver bottomed in 2015. In 2016, silver began (or resumed) its bull market. This is further supported by the huge moves on the 2016 chart above. This is because, generally speaking, in bull markets, the biggest moves are to the downside, and in bear markets, the biggest moves are to the upside.
And what do we see in 2017? A very slow and painful grind to the upside full of emotional hope and hopelessness all wrapped into eleven months.
So far, we have been spared the massive drop in price this November. This is not to say it’s not coming. We don’t know if it is or not, but we do now this:
The cartel absolutely loves to smash price during the holidays. Most people who are working on Wednesday are ineffective in their jobs as they have one thing in mind, the markets are closed on Thursday for Thanksgiving, and on Black Friday, again, work is about the last thing on most people’s mind.
And so for silver bugs it can be painful to watch, because the cartel has been successful in strong-arming the market during the holiday week.
If somehow we can manage a close above $17.45 on the daily in the chart above, then silver will have managed to take a big step forward in resuming the uptrend. Not shown with an arrow because we’d all rather have some hope, but a close below $16.71 and it most likely will, yet again, be a painful close to 2017.
At $17.20 we have a ray of hope because the price action has been positive to the upside and we are above both the 50-day and the 200-day.
Silver has also come back down on the GSR:
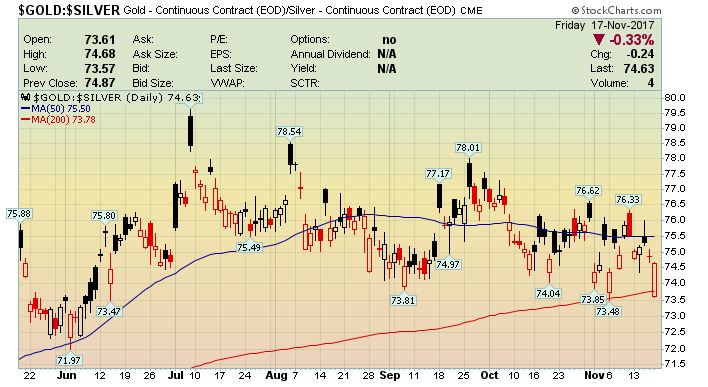
Silver is below the 200-day in terms of how many ounces of silver it takes to buy one ounce of gold.
Gold ended the week well last week with momentum:
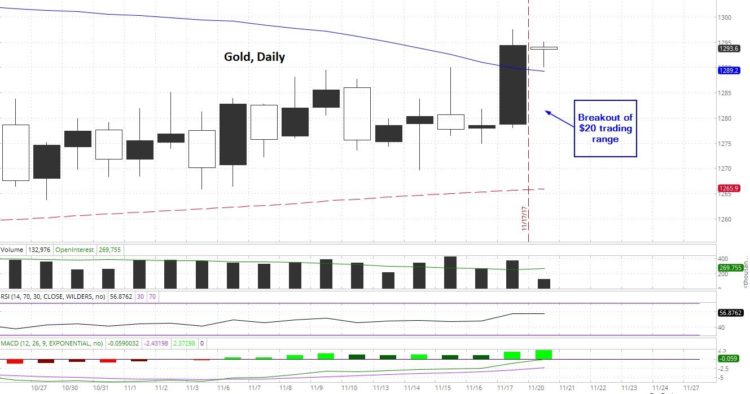
Gold has broke out of what was essentially a $20 trading range. Plus, the surge on Friday put the gold price above its 50-day.
It’s not shown on the graph above, but the resistance is the October 13 close at $1306.
At only $10-$15 it seems so close, but we can be certain the cartel will not give up that price level without a fight.
Platinum also had a huge surge on Friday:
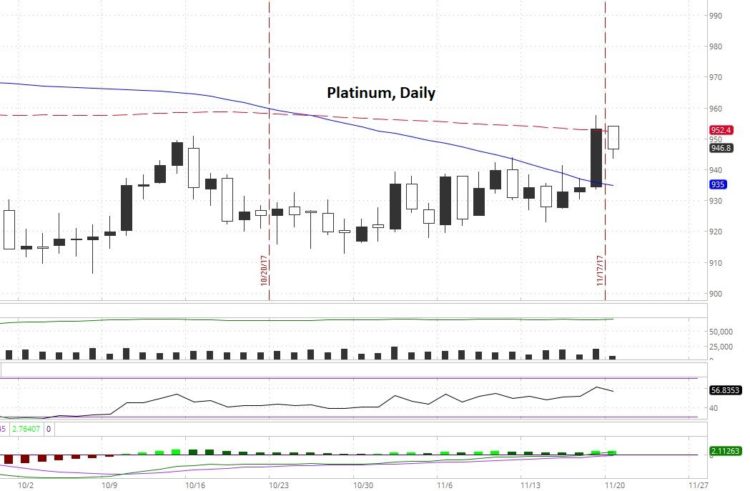
Yet overnight we can already see the precious metal coming down off of the move.
But this is not to cast a negative light, because palladium is holding up and in fact rose overnight:
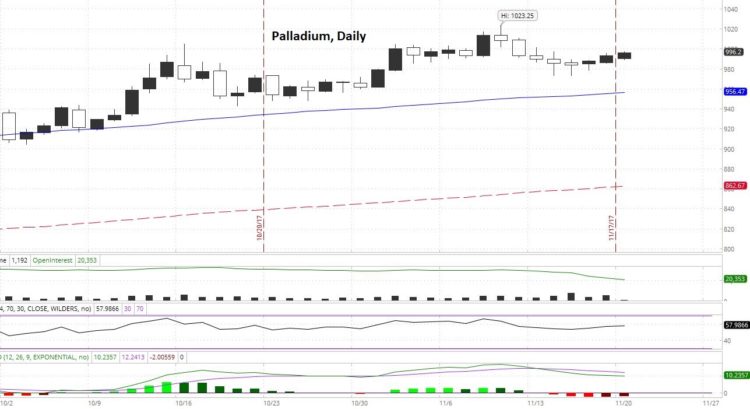
Palladium is the only precious metal that has not pulled back from the move on Friday.
Copper begins the week looking as if the base metal is going to ride the 50-day to either side for a while:
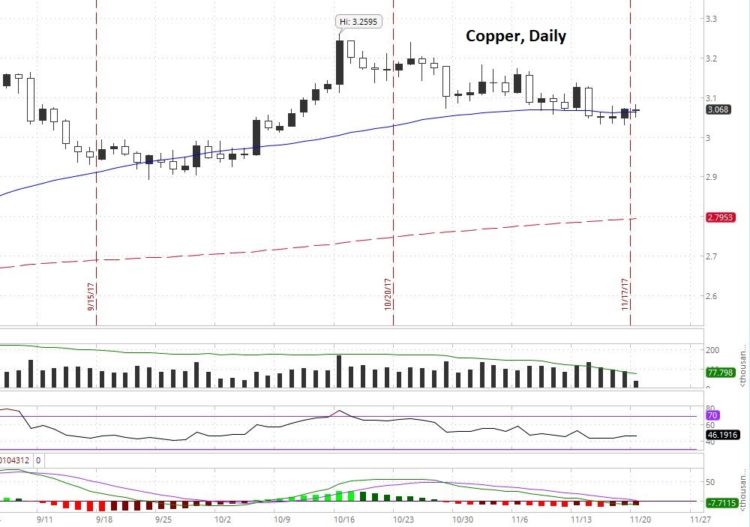
Which is exactly what it did last time it revisited the moving average.
Crude is still above $56 going into the holiday-shortened trading week:
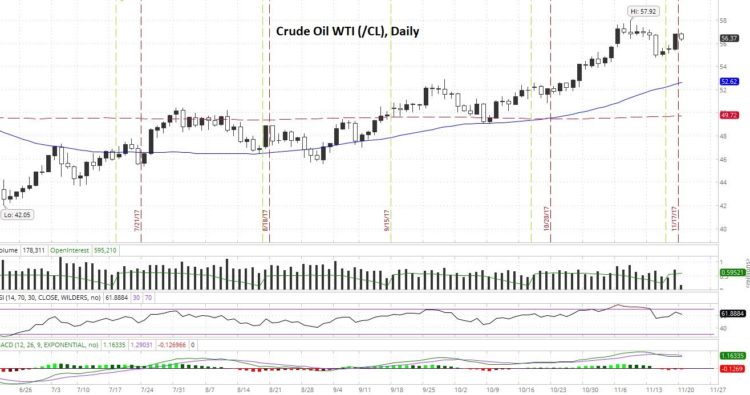
If there is a current example of “climbing a wall of worry” then it is with crude. The doubt in the rise is exactly what everybody was feeling when the metals began moving up in 2016. Nobody was ready to call it a new bull market for some time.
The yield on the 10-year note is right smack in the middle of the 2.3% to 2.4% range:
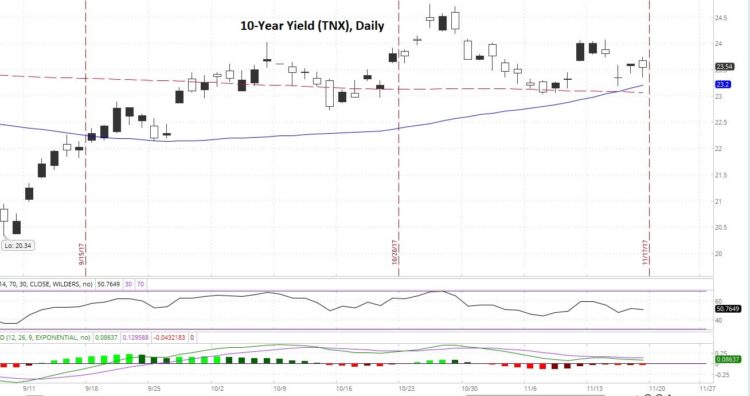
On Wednesday, the Fed minutes from the November FOMC meeting (Nov 1) are going to be released. That may have an effect on the treasury market, and it’s shown in the range-bound yield above.
The Fed always releases its minutes three weeks after the meeting. This is a key way they can fundamentally manipulate or “jawbone.” You see, we are told that the release is the notes on what was discussed at their last meeting, but for those who are unaware, what the minutes really represent is an opportunity for the Fed to re-work the markets in any way they may need re-working to the Fed’s liking.
That is to say, the Fed will be looking to talk the markets for itself and its banker cohorts and the MSM will be cheering and supportive in whatever way it can.
What we need to know for the prices of gold and silver is that the minutes can be released and the metals can move off of the headlines. We know which way the Fed wants them to move, so we must all be on guard for a price attack.
The dollar is barely treading water above its 50-day:
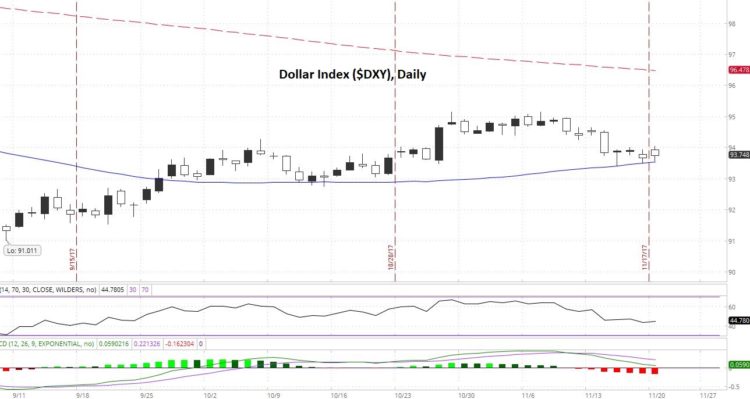
If the dollar breaks down through the 50-day, that will be bullish for gold and silver, however, just like the minutes can have an affect on the treasury market, the minutes can also have an effect on the dollar.
If the Dow is going to reach 24,000 it better get moving:
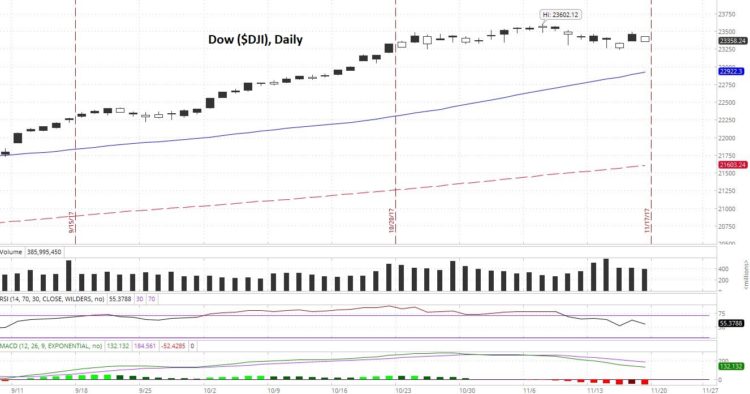
Because if it’s not reaching record highs every other day, do we then dare say it’s run out of gas?
Finally, presented with no comment: Bitcoin
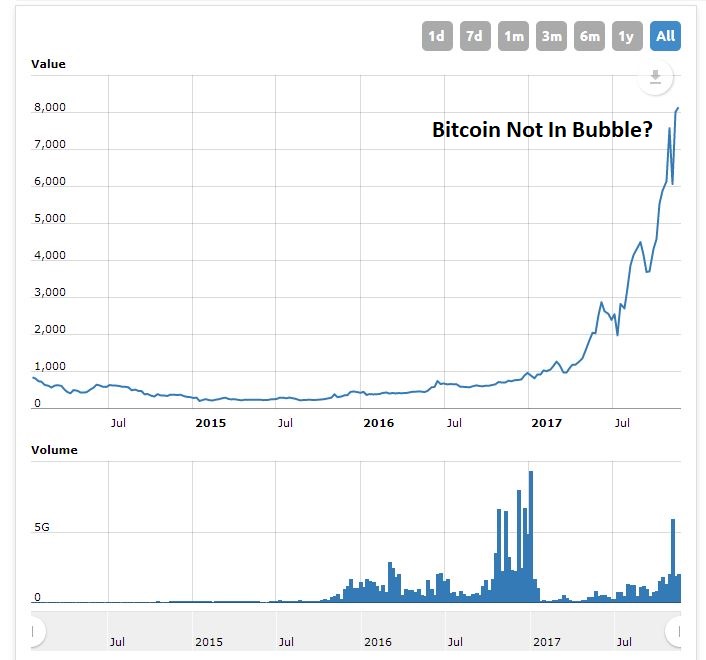
Stack accordingly.
The iShares Silver Trust ETF (NYSE:SLV) was trading at $16.13 per share on Monday morning, down $0.18 (-1.10%). Year-to-date, SLV has gained 6.75%, versus a 16.56% rise in the benchmark S&P 500 index during the same period.
SLV currently has an ETF Daily News SMART Grade of B (Buy), and is ranked #10 of 35 ETFs in the Precious Metals ETFs category.
