Breaking News
Investing Pro 0
Free Webinar - Webinar: Simplify Options Trading | Thursday, September 28, 2023 | 08:00PM EDT Enroll Now

The Silver:Gold Ratio's Message About The Bullish Case For Precious Metals

By Andy HechtCommoditiesJun 08, 2020 06:25AM ET
www.investing.com/analysis/silvergold-ratio-200526994
The Silver:Gold Ratio's Message About The Bullish Case For Precious Metals
By Andy Hecht   |  Jun 08, 2020 06:25AM ET
Saved. See Saved Items.
This article has already been saved in your Saved Items
 
 
XAU/USD
-0.05%
Add to/Remove from Watchlist
Add to Watchlist
Add Position

Position added successfully to:

Please name your holdings portfolio
 
XAG/USD
-0.31%
Add to/Remove from Watchlist
Add to Watchlist
Add Position

Position added successfully to:

Please name your holdings portfolio
 
Gold
0.00%
Add to/Remove from Watchlist
Add to Watchlist
Add Position

Position added successfully to:

Please name your holdings portfolio
 
Silver
-0.11%
Add to/Remove from Watchlist
Add to Watchlist
Add Position

Position added successfully to:

Please name your holdings portfolio
 

This article was written exclusively for Investing.com

  • New modern-day high in March
  • The ratio turns lower
  • Memories of 2008-2011 in the silver and gold markets, and the ratio

The silver:gold ratio dates back thousands of years. In around 3000BC, the first Egyptian Pharaoh, Menes, declared that two and one-half parts silver equals one-part gold.

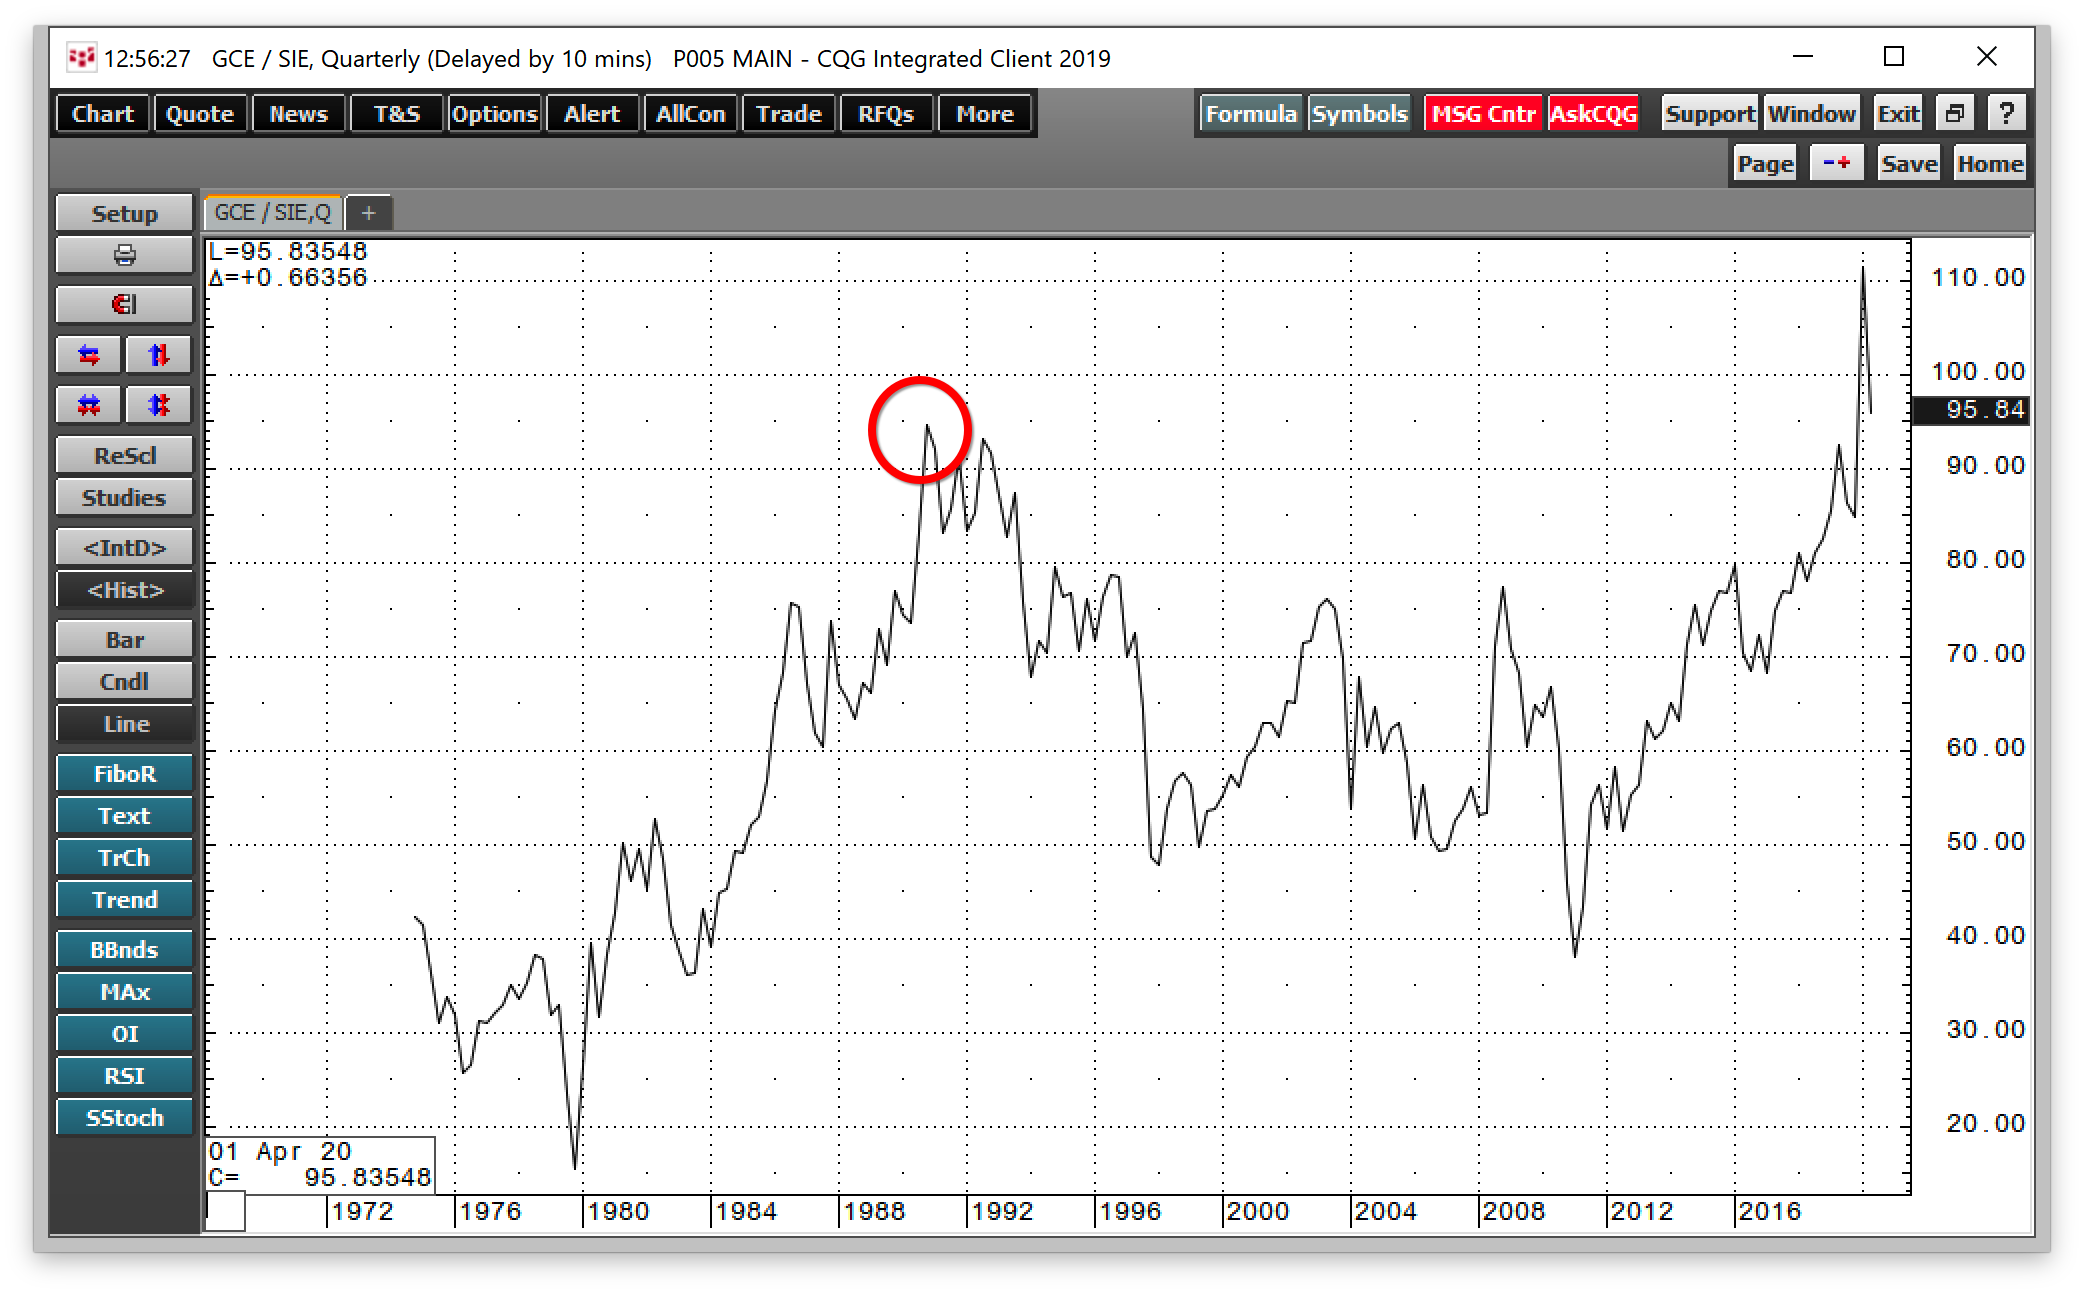
In modern times, since silver and gold began trading on the COMEX futures exchange, the average of the price relationship between the two precious metals had been around the 55:1 level, where it also stood at the beginning of 2020. The high came in 1990 and the low in 1979. When the ratio is below the average level, silver is historically cheap compared to gold; when it's above, the white metal is considered expensive.

The ratio is an inter-commodity spread, but it reflects the potential for substitution between the two metals. Gold and silver have long histories as both commodities and currencies. For centuries, and before biblical times, gold and silver were symbols of wealth and money. In the US, one of the leading issues during the 1896 Presidential election between William McKinley and William Jennings Bryan was whether to use gold or silver as backing for the US dollar. McKinley and gold won the election.

In March, risk-off conditions in markets across all asset classes pushed the price of silver to the lowest level since 2009 when it fell below $12 per ounce. The move propelled the silver:gold ratio to a new all-time peak.

New modern-day high in March
Silver:Gold Ratio Daily

Source, all charts: CQG

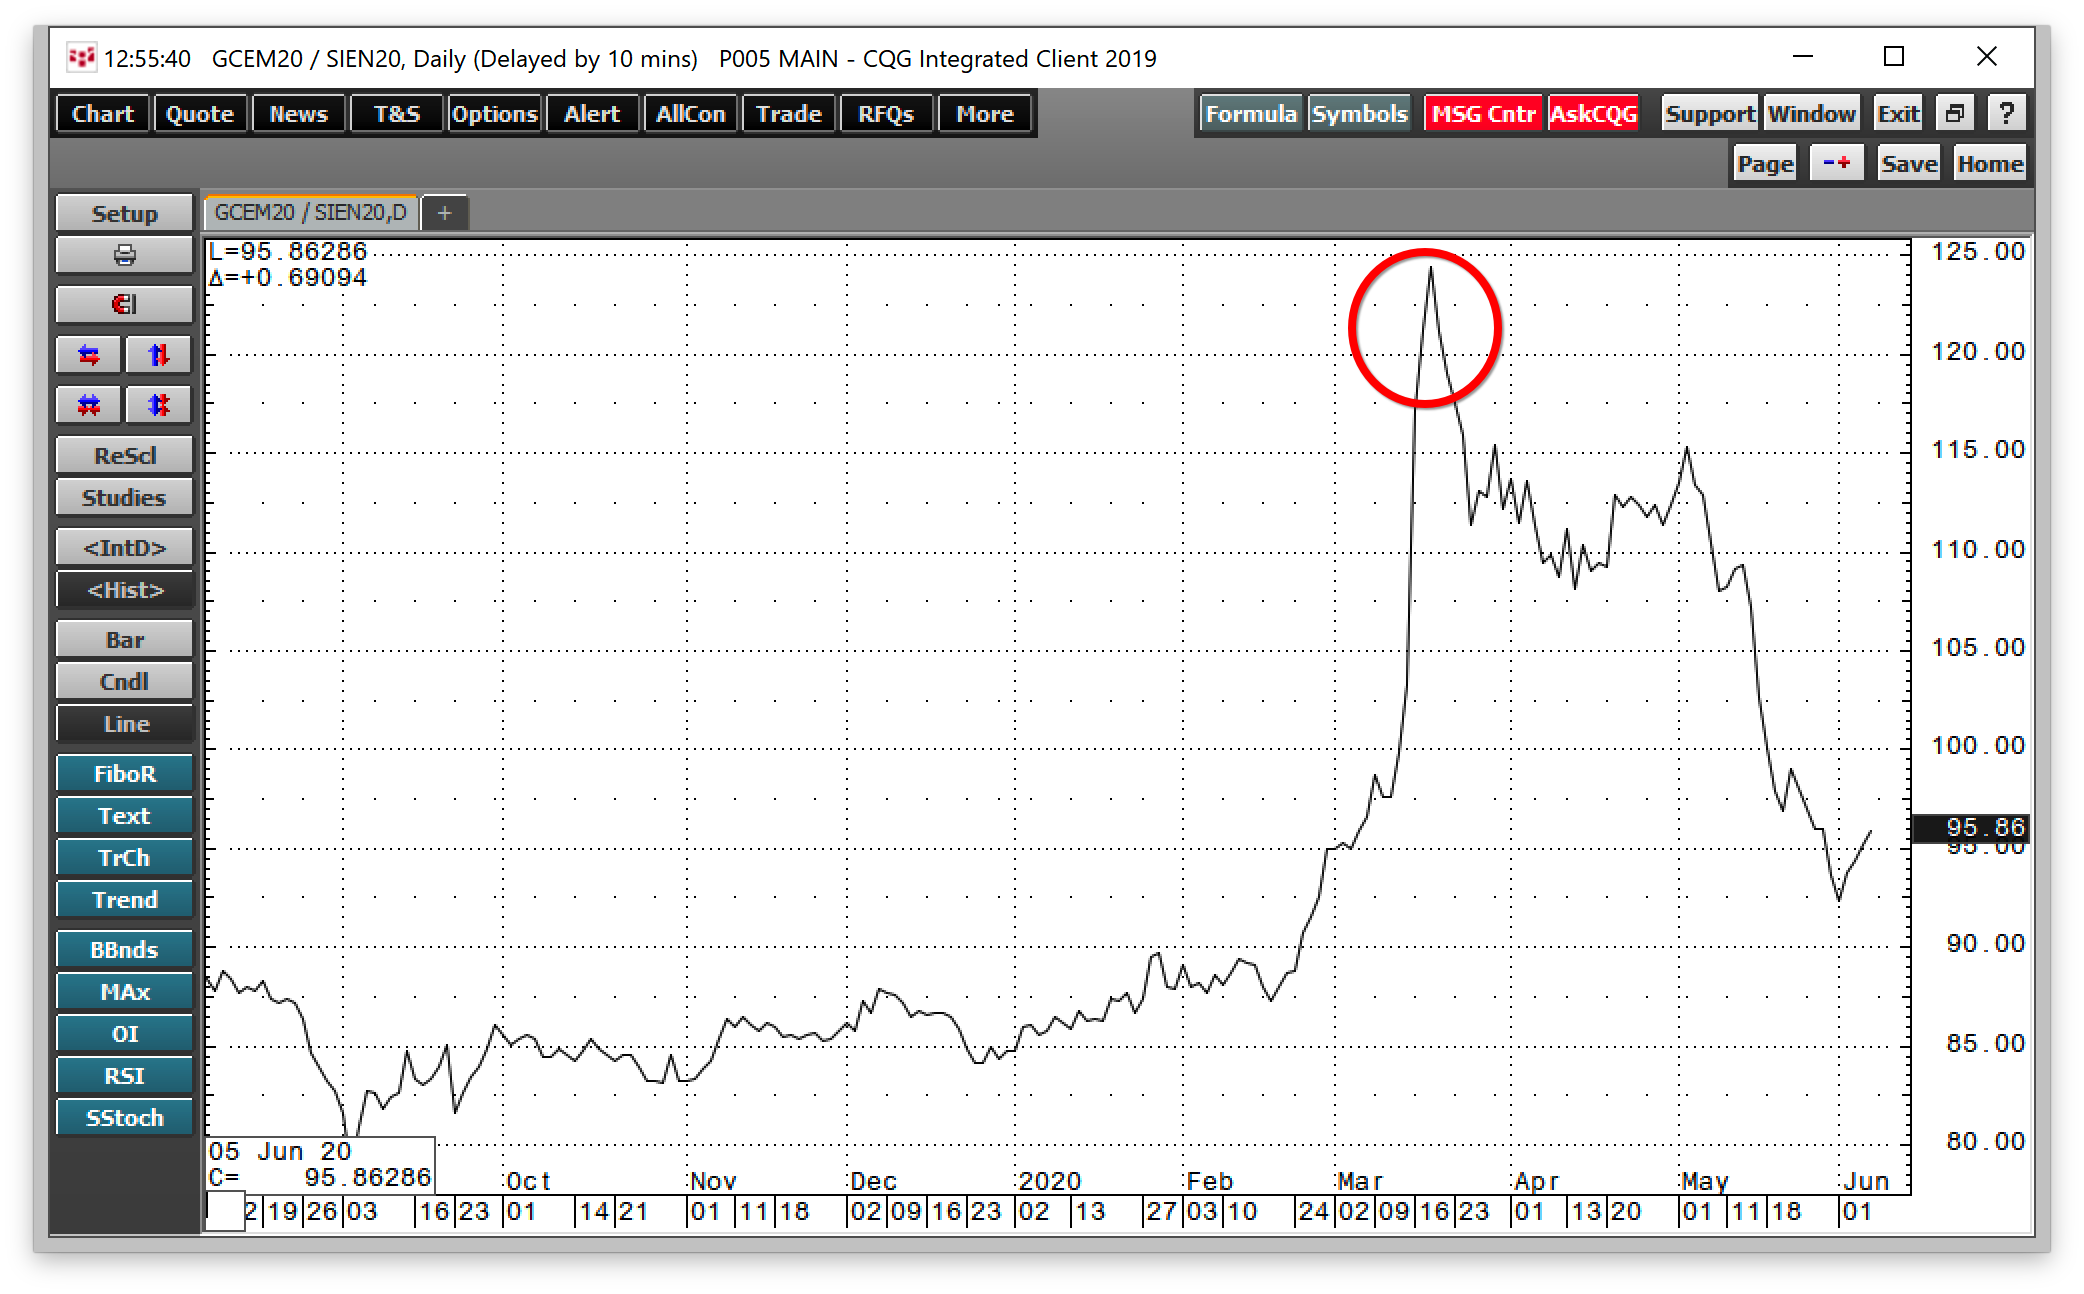
The daily chart of June COMEX gold futures divided by July COMEX silver futures, above, shows the ratio's peak in March.
Silver:Gold Ratio Quarterly

The relationship reached a high of 124.4 ounces of silver value to each ounce of gold value on March 18. The quarterly chart illustrates the previous high in 1990 that was below the 95:1 level in the ratio.

The ratio turns lower

The ratio has declined steadily since the March high, reaching its most recent low at 92.32:1 on June 1. Last Friday, it was trading below the 96:1 level.

Historically, the ratio tends to rise during periods when there's a bear market and fall during bullish trends. The low at 15.47:1 came in 1979 when silver was on its way to $50.36 and gold to $875. At the time, those prices were record highs. By 2011 the ratio fell to a low of 38:1. Three years after the 2008 financial crisis, silver was moving towards its most recent high of $49.82 and gold to its record peak at $1920.70 per ounce.

In 1990, at the previous high in the ratio, gold and silver traded to respective lows of $346 and $3.93 per ounce. Time will tell if the turn lower in the ratio is a sign that higher prices are on the horizon.

Memories of 2008-2011 in the silver and gold markets, and the ratio

Perhaps the most compelling bullish case for gold and silver is the unprecedented level of central bank and government stimulus flowing into the financial system in 2020. From June to September 2008, the US Treasury borrowed a record $530 billion to fund economic stimulus. During May 2020, the Treasury had already spent $3 trillion, more than five times that amount.

That liquidity was rocket fuel for the silver and gold markets from 2008 through 2011. The same might be true for the coming years.

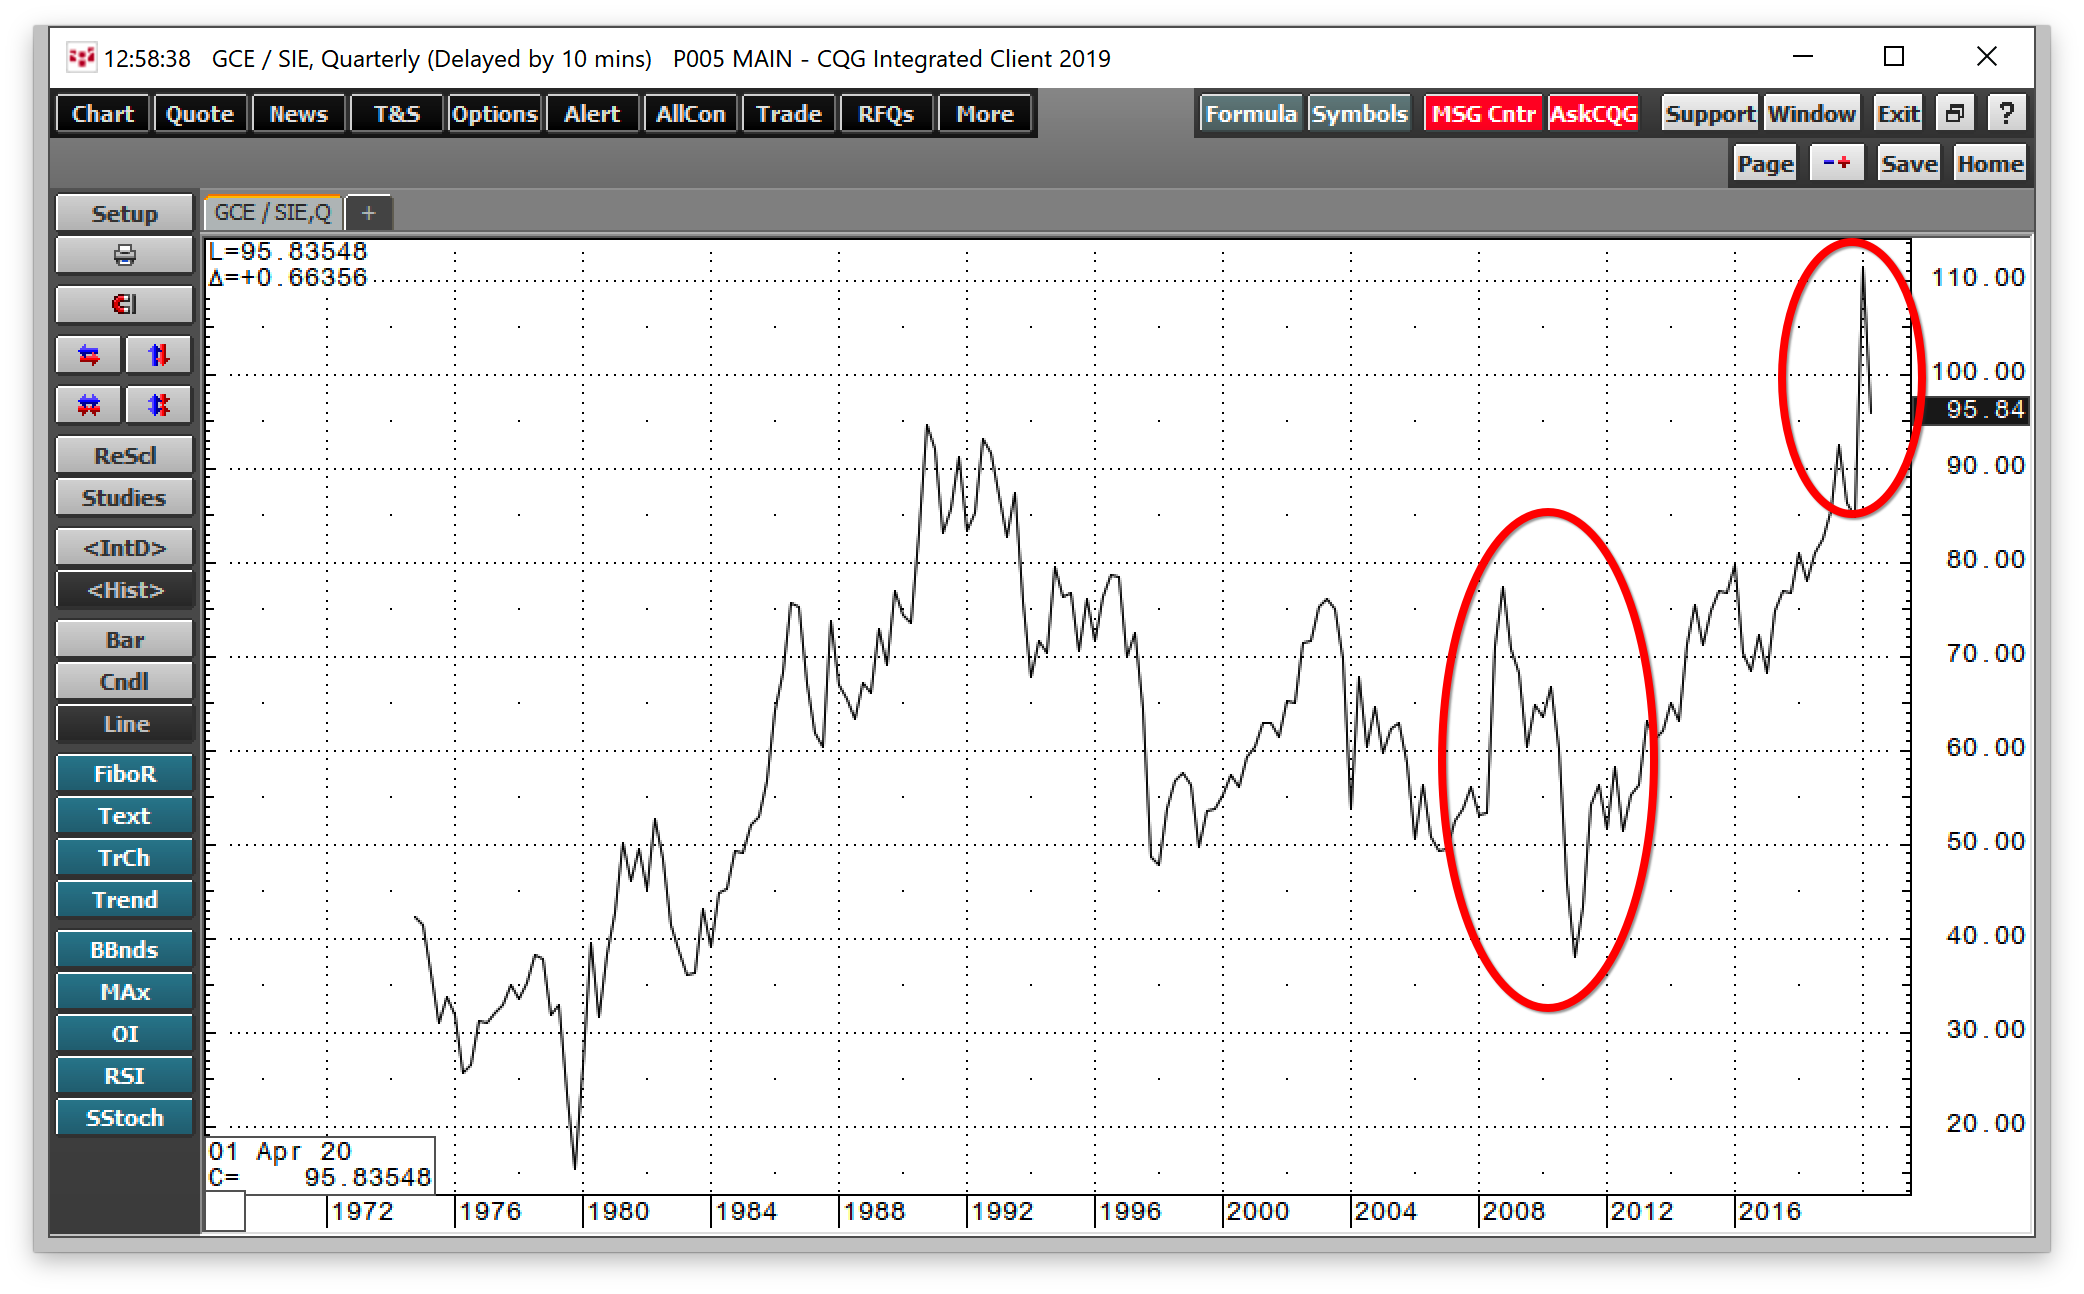
Indeed, the move in the ratio from 2008 through 2011 could be a model for the future.
 

Silver:Gold Ratio Quarterly Low

The chart above shows that in 2008, the kneejerk reaction in the relationship was a move to a high of 77.37:1, then the highest level since 1996. Afterward, it fell to 38:1, the lowest since 1983.

Will government and Fed stimulus cause a similar move in the years ahead? The jury is still out, but the unprecedented level of liquidity in the global financial system is a compelling case that history will repeat. 

The Silver:Gold Ratio's Message About The Bullish Case For Precious Metals
 

Related Articles

The Silver:Gold Ratio's Message About The Bullish Case For Precious Metals

Add a Comment

Comment Guidelines

We encourage you to use comments to engage with other users, share your perspective and ask questions of authors and each other. However, in order to maintain the high level of discourse we’ve all come to value and expect, please keep the following criteria in mind:  

  •            Enrich the conversation, don’t trash it.

  •           Stay focused and on track. Only post material that’s relevant to the topic being discussed. 

  •           Be respectful. Even negative opinions can be framed positively and diplomatically. Avoid profanity, slander or personal attacks directed at an author or another user. Racism, sexism and other forms of discrimination will not be tolerated.

  • Use standard writing style. Include punctuation and upper and lower cases. Comments that are written in all caps and contain excessive use of symbols will be removed.
  • NOTE: Spam and/or promotional messages and comments containing links will be removed. Phone numbers, email addresses, links to personal or business websites, Skype/Telegram/WhatsApp etc. addresses (including links to groups) will also be removed; self-promotional material or business-related solicitations or PR (ie, contact me for signals/advice etc.), and/or any other comment that contains personal contact specifcs or advertising will be removed as well. In addition, any of the above-mentioned violations may result in suspension of your account.
  • Doxxing. We do not allow any sharing of private or personal contact or other information about any individual or organization. This will result in immediate suspension of the commentor and his or her account.
  • Don’t monopolize the conversation. We appreciate passion and conviction, but we also strongly believe in giving everyone a chance to air their point of view. Therefore, in addition to civil interaction, we expect commenters to offer their opinions succinctly and thoughtfully, but not so repeatedly that others are annoyed or offended. If we receive complaints about individuals who take over a thread or forum, we reserve the right to ban them from the site, without recourse.
  • Only English comments will be allowed.
  • Any comment you publish, together with your investing.com profile, will be public on investing.com and may be indexed and available through third party search engines, such as Google.

Perpetrators of spam or abuse will be deleted from the site and prohibited from future registration at Investing.com’s discretion.

Write your thoughts here
 
Are you sure you want to delete this chart?
 
Post
Post also to:
 
Replace the attached chart with a new chart ?
1000
Your ability to comment is currently suspended due to negative user reports. Your status will be reviewed by our moderators.
Please wait a minute before you try to comment again.
Thanks for your comment. Please note that all comments are pending until approved by our moderators. It may therefore take some time before it appears on our website.
Comments (5)
Gervais Christopher
Gervais Christopher Jun 08, 2020 5:25PM ET
Saved. See Saved Items.
This comment has already been saved in your Saved Items
ho hum...shocker....
John Hamlett
John Hamlett Jun 08, 2020 11:29AM ET
Saved. See Saved Items.
This comment has already been saved in your Saved Items
Hadn't thought about this before, but it's interesting when considering the Gold:Silver ratio - what's normally reported is the paper price gold:silver ratio, the actual gold:silver ratio (should you want to buy physical) is 10% less.  It's around the 85:1 ratio.  I haven't tried this myself, but I suppose you could go to a LCS and request a swap, it's possibly they'd use the paper price for the swap, in which case the silver for gold request might work in your favor.  Typically though I think they look at what they buy gold per oz for and what they sell silver per oz for and figure it out that way.
Bilbo Biggun
Bilbo Biggun Jun 08, 2020 11:29AM ET
Saved. See Saved Items.
This comment has already been saved in your Saved Items
Using an online dealer you have to add shipping to the cost of your silver. Using a local coin shop, you have to factor in the scarcity of physical gold. I suspect that if/when the ratio falls into the 70s or 60s (or below) there will be no gold to swap into to.
Zoofu Phill
Zoofu Phill Jun 08, 2020 11:07AM ET
Saved. See Saved Items.
This comment has already been saved in your Saved Items
Gold is the new Tesla
Sum Toast
Sum Toast Jun 08, 2020 11:02AM ET
Saved. See Saved Items.
This comment has already been saved in your Saved Items
The (((central banks))) can't allow for interest rates to rise or it literally implodes. The markets got spooked at the end of 2018 because Powell began to raise rates. It's impossible. So, they shall print the US Federal Reserve Note into oblivion.
Enron Mask
Enron Mask Jun 08, 2020 10:20AM ET
Saved. See Saved Items.
This comment has already been saved in your Saved Items
So far liquidity goes to zoom, Tesla, beyond meat, etc..
Umar Farooq
Umar Farooq Jun 08, 2020 10:20AM ET
Saved. See Saved Items.
This comment has already been saved in your Saved Items
hello
Connor Murphy
Connor Murphy Jun 08, 2020 10:20AM ET
Saved. See Saved Items.
This comment has already been saved in your Saved Items
Beyond meat was six deep and five wide on store shelves when the crappiest cuts of beef and pork were nowhere to be seen.
 
Are you sure you want to delete this chart?
 
Post
 
Replace the attached chart with a new chart ?
1000
Your ability to comment is currently suspended due to negative user reports. Your status will be reviewed by our moderators.
Please wait a minute before you try to comment again.
Add Chart to Comment
Confirm Block

Are you sure you want to block %USER_NAME%?

By doing so, you and %USER_NAME% will not be able to see any of each other's Investing.com's posts.

%USER_NAME% was successfully added to your Block List

Since you’ve just unblocked this person, you must wait 48 hours before renewing the block.

Report this comment

I feel that this comment is:

Comment flagged

Thank You!

Your report has been sent to our moderators for review
Continue with Google
or
Sign up with Email