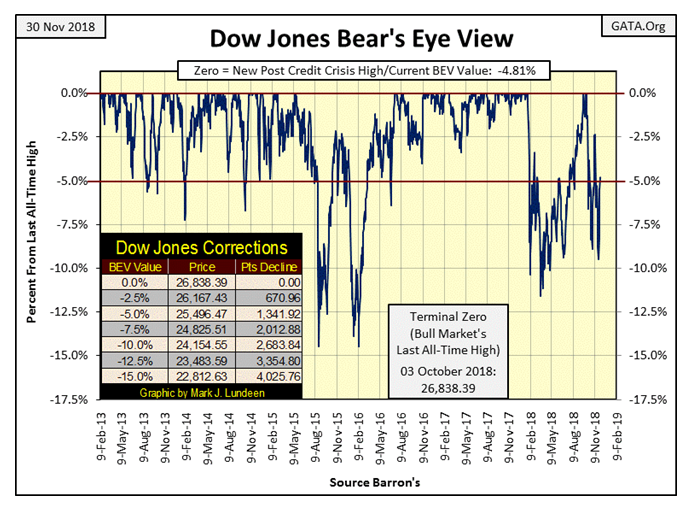
I last wrote an article on Friday November 9th as the Dow Jones closed with a value of -3.13% in the BEV chart below. Three Friday’s later and the Dow Jones closed today with a value of -4.81%. Not much of a difference, until we note between these two Fridays the Dow Jones almost broke below its BEV -10% line only six NYSE trading sessions ago, last Friday November 23rd.

Then, beginning Monday this week the Dow Jones recovered 1252 points, a full five BEV points in only five trading sessions: very impressive. CNN took note, and reported exactly why on Wednesday the Dow Jones jumped over 600 points (a Dow Jones +2.50% day); the Federal Reserve intends to slow down increasing interest rates.
https://www.cnn.com/2018/11/28/investing/stock-market-today-dow-fed-jerome-powell/index.html
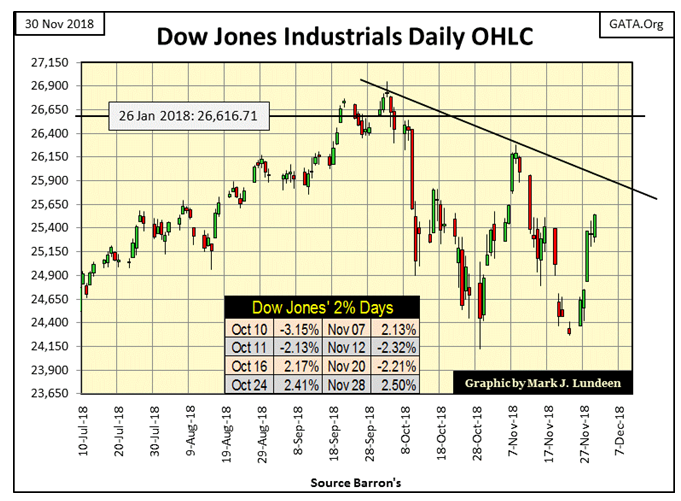
As per CNN, the Federal Reserve intends not to pop the bubble they inflated into the stock market any time soon, though CNNchose to describe the Fed’s action differently than I have. That’s good news, but somehow looking at the Dow Jones in daily bars below tells me the problems the stock market is currently facing may not be as simple to solve as the “market experts” at CNN would have us believe.
Look at the increase in market volatility for the Dow Jones since its October 3rd last all-time high. For the past two months it’s been classical bear market action, with eight new Dow Jones 2% days in the past two months. During market advances we can go for years without seeing even one Dow Jones 2% day, and now we’ve seen eight of them in the past two months?
I’m out of the market prediction business. I haven’t a clue what’s to happen next with the Dow Jones. So I’m not predicting it, and I think it unlikely, but should the Dow Jones see a new all-time high before Christmas I wouldn’t be surprised. Should the Federal Reserve “inject” sufficient “liquidity” into the stock market, anything is possible.
However, when comparing the daily bars below before October 3rd with those after, the only thing that comes into my mind is BEAR-MARKET ACTION. This is the type of market where the Dow Jones could collapse into panic selling without further notice, taking other financial-market assets down with it.

With a market and economy carrying as much debt as isours, a catastrophic market collapse is something to be anticipated. Take for example former blue-chip stock General Electric (NYSE:GE), formerly a solid company which today is leading the charge down into the abyss. In July 2016 it traded at $32; today it closed at $7.50, a loss of 76.6%.
What happened to GE? I don’t exactly know, but in time I expect we’ll discover a large factor in its demise was GE assuming more debt than it could service.
Here’s an article from Wolfstreet.Com explaining the problems bond ETFs are having. But the exact same thing could be said for the pending debt problemsmany large blue-chip companies are now facing. The only difference is these corporations are the issuers of the bonds, while the ETFs are their current holders.
https://wolfstreet.com/2018/11/29/potentially-treacherous-times-for-bond-funds-ahead/
Individuals as well as corporations carry more debt than they can reasonably service. But a CNBC “market expert” in the following link tells us it’s nothing to worry about.
Here’s a bear-market fact of life: during market declines daily volatility in the Dow Jones increases, and the Dow Jones will begin experiencing daily moves of +/-2% or greater from a previous day’s closing price. I call these days Dow Jones 2% days or days of extreme-market volatility. An interesting market fact is historically the Dow Jones has seen its largest daily percentage advances during bear markets, not during bull markets as one would expect.
Large daily percentage moves in the Dow Jones can occur during market advances, but rarely. However, during market declines their occurrences become common market events, as seen in the chart below.
The plot below is from January 1900 to today, 119 years of market history, and we are looking at the number of Dow Jones 2% days in a running 200 day sample. Market advances occur in the declinesfrom peaks in the Dow Jones 200 count, and market declines can be identified as the 200 count begins to increase, with bear market bottoms occurring near peaks in the plot.
To read the entire report Please click on the pdf File Below..
