

Here we are at the halfway point of the year, less than two months away from the Rio 2016 Olympic Games. As a group, commodities are the top performing asset class, beating domestic equities, the U.S. dollar and Treasuries.

Below is our ever-popular Periodic Table of Commodities Returns, updated to reflect the first half of 2016.
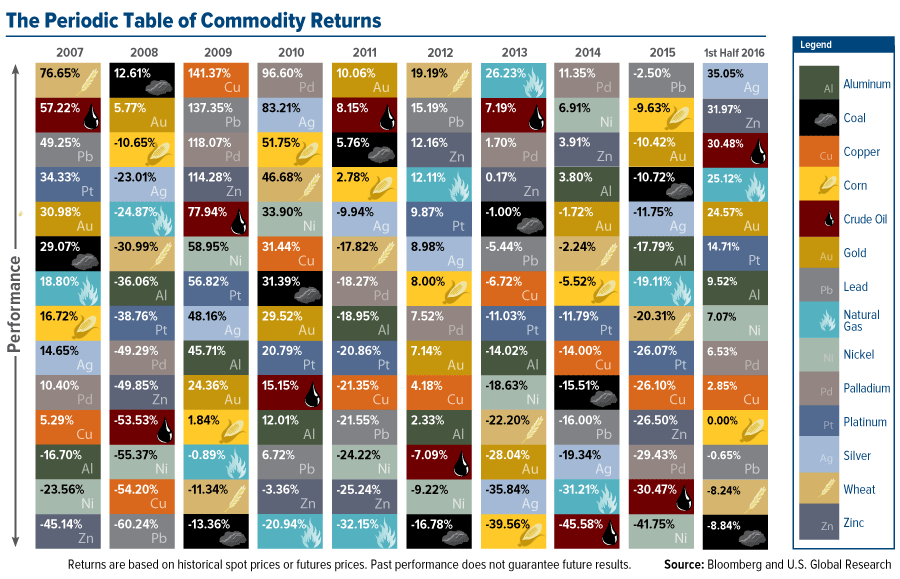
Commodities’ performance is quite a reversal from the weakness we’ve seen lately, particularly last year, but we shouldn’t expect another 2004 or 2005, when global trade was humming. Conditions are still not ripe for a real takeoff, with manufacturing activity in China and the eurozone struggling to gain momentum.
But there’s hope. Many of the challenges standing in the way of growth were exposed when Britain voted last month to leave the European Union (EU), which I’ve been writing about for the past few weeks. Most recently, I highlighted some of the winners to emerge from Brexit, among them gold investors, U.S. homeowners and British luxury goods makers.
Hopefully we can add global trade to the list. Brexit has brought to light some of the corruption and economic strangulation by regulation that chokes the flow of capital. Last week I had the opportunity to speak with some EU citizens. Their frustration was palpable.
The cronyism among the EU’s unelected officials is nothing new, but it’s only worsened over the past decade and a half, they said. The British referendum has encouraged a balanced, intercontinental discussion on the direction Brussels must take now that the corruption and depth of discontent have been exposed for the world to see.
Precious Metals Shine Brightly on Macroeconomic and Geopolitical Concerns
Silver demand had a phenomenal 2015, with retail investment and jewelry fabrication both reaching all-time highs. Led by consumers in the U.S. and India, coin and bar investment soared 24 percent from the previous year, while jewelers gobbled up a record 226.5 million ounces.
According to the Silver Institute’s World Silver Survey 2016, metal demand for photovoltaic installation climbed 23 percent in 2015, offsetting some of the losses we continue to see in photographic applications.

Caused by worries of a summer interest rate hike and uptick in the U.S. dollar, gold and silver both stalled in May but have since rallied on the back of Brexit and with government bond yields in freefall. For the first time ever, Switzerland’s entire stock of bonds has fallen below zero, with the 50-year yield plummeting to negative 0.03 percent on July 5.

All-time low yields can also be found in the U.S. too. The 10-year Treasury yield fell nearly 38 percent in the first half—in the U.K., Canada, Germany, France, Australia, Japan and elsewhere as well. Roughly $10 trillion worth of global government debt, in fact, now carry low to subzero yields.
This has been highly constructive for gold and silver, as yields and precious metals tend to be inversely related.
What’s more, the rally doesn’t appear to be done, with UBS analysts making the case last week that we’re in the early stages of a new bull run. Credit Suisse sees gold testing the $1,500 an ounce mark as early as the beginning of 2017. As for silver, some forecasters place it at between $25 and $32 an ounce by year’s end.
The risk now is that higher prices are pushing away some potential investors. Yesterday, Bloomberg reported that gold imports in India plunged a sizable 52 percent in the first half of 2016, compared to the same period in 2015.
Supply and Demand Rebalancing?
Much of the price appreciation has been driven by a global rebalance in supply and demand. Dismal prices over the last couple of years compelled explorers and producers to cut activity and other capital expenditures, while demand continues to rise.
This dynamic certainly helped zinc, the best performing industrial metal of 2016 so far. During the first four months of the year, mine production fell 8.1 percent from the same time a year earlier due to declines in Australia, India, Peru and Ireland, according to the International Lead and Zinc Study Group. In January, London-based Verdanta Resources made its last zinc shipment from its Lisheen Mine in Ireland, which for the last 17 years had produced an average 300,000 tonnes of zinc and 38,000 tonnes of lead concentrate per year.
Meanwhile, the demand for refined zinc, used primarily to galvanize steel, is expected to increase 3.5 percent this year.
What might surprise you is that a large percentage of this growth can be attributed to China, which is still investing heavily in infrastructure, even as money supply growth has slowed.
This rebalancing has also bolstered crude oil prices, up 73 percent since its 2016 low in February. Unplanned production outages in Canada, Nigeria, Iraq and elsewhere removed a collective 3.6 million barrels per day off the market in May alone. Coupled with ongoing declines in the North American rig count—U.S. crude production is now at a two-year low—this helped nudge prices up to levels not seen since July 2015.

At the same time, global consumption is expected to increase by 1.5 million barrels a day both this year and next, according to the U.S. Energy Information Administration (EIA), with North America and Asia, particularly China and India, responsible for much of the growth.
Record Automobile Sales Support Commodities
Crude consumption is also being supported by robust automobile sales, which set a six-month record in the U.S. following six straight years of growth. Between January and June, sales reached an all-time high of 8.65 million units, up 1.5 percent from the same period last year. In China, the world’s number one auto market, 10.7 million vehicles were sold in the first five months, an impressive year-over-year increase of 7 percent. Sales of light vehicles, especially motorcycles, have been strong in India.
As you might expect, this has likewise benefited demand for platinum and palladium, both used in the production of auto catalysts. The CPM Group anticipates palladium demand to reach an all-time high this year, up 3 percent from last year, on tightened emissions standards and the purchase of larger cars and trucks in the U.S. on lower fuel costs. (The larger the engine, the more palladium or platinum is needed to reduce emissions.)

Since January, the platinum group metals (PGMs) have increased over a third in price, marking the end of an 18-month bear cycle, according to Metals Focus’ Platinum & Palladium Focus 2016. Fundamentals have improved since last year, when EU growth concerns and Volkswagen's (OTC:VLKAY) emissions scandal weighed heavily on investment prospects.
Like zinc, crude and other commodities, the PGMs were supported the last six months by lower output levels, as labor disputes in South Africa—the world’s largest platinum producer and number two largest palladium producing country—disrupted operations.
Disclosure: All opinions expressed and data provided are subject to change without notice. Some of these opinions may not be appropriate to every investor. Certain materials in this commentary may contain dated information. The information provided was current at the time of publication.