
Silver and gold — two precious metals with a rich history, and they are thick as thieves. Investors can learn a lot from their market dynamics and correlation, especially when silver is so cheap. (Is it?)
In this article, FBS experts delve into the fascinating world of these two assets to explore the historical context of the gold-silver ratio, and assess the present market landscape.
Historical Perspective on the Gold-Silver Ratio
The gold-silver ratio (GSR) represents the price of an ounce of gold in ounces of silver. The correlation between these two metals has been recorded since the 1600s. Since the early 1900s, the GSR has ranged between 17 and 100, with the data from 1950 till the present day averaging out at 40-50.
- From 1919 to 1940 the gold-silver ratio soared from 18.50 to 99.76, mostly because of the shift to a fiat-backed system following the establishment of the US Federal Reserve in 1913.
- Later, the ratio fell significantly. Despite gold having a fixed price as of 1933, the ratio began to see a real drop in 1940. After the International Monetary Fund was established in 1944, one dollar was valued at 0.888671 grams of fine gold, or $35 an ounce. At the same time, silver didn’t have those limitations and soared from $0.35 in 1940 to $2.38 in 1968, causing the GSR to reach its lowest point of the century at 16.76.
- The ratio made a second bottom in 1980 after US inflation reached double digits the year before. On January 21, 1980, also known as “Silver Thursday”, the gold fixing came to $850. This date has become the highest point for silver. It reached $39, and then fell to $12.6 over the next four months.
- Prices were highly volatile but still moving inside the historical model. However, after Silver Thursday, its price continued to decrease faster than gold’s. The GSR started to gain an upside momentum.
- The peak of 94.83 was reached in 1991, after the start of the 1st Gulf War.
- Another rapid growth occurred near the end of 2008 amid fears of economic uncertainty, the subprime crisis, and so on. The rate surged from 52 to 76 and decreased over the next three years.
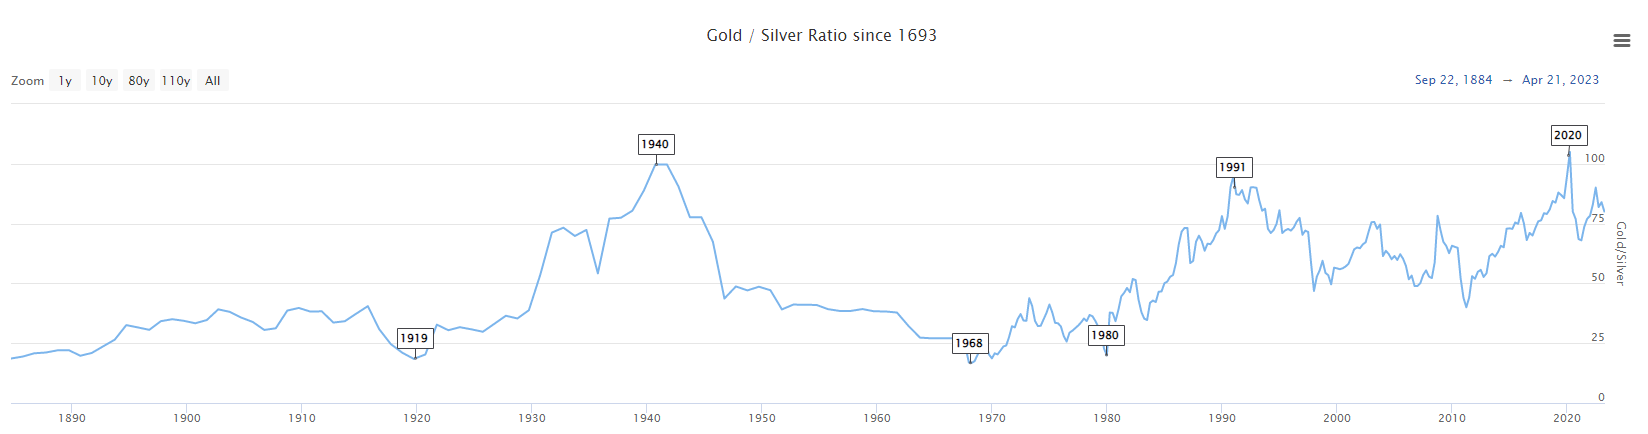
Source: longtermtrends.net
Here’s what all of that means to us: Gold has proven its mettle as a long-term safe haven and inflation hedge, while silver acts as a lagging indicator for its yellow counterpart. Every time the GSR made a sharp advance, a slow and lasting correction has always followed.
Current Market Situation
The last jump in the GSR happened in 2020, at the start of the Covid-19 pandemic, when the ratio went from 86 to 111. Yet, even in the face of the global recession, the ratio is slowly decreasing again now.
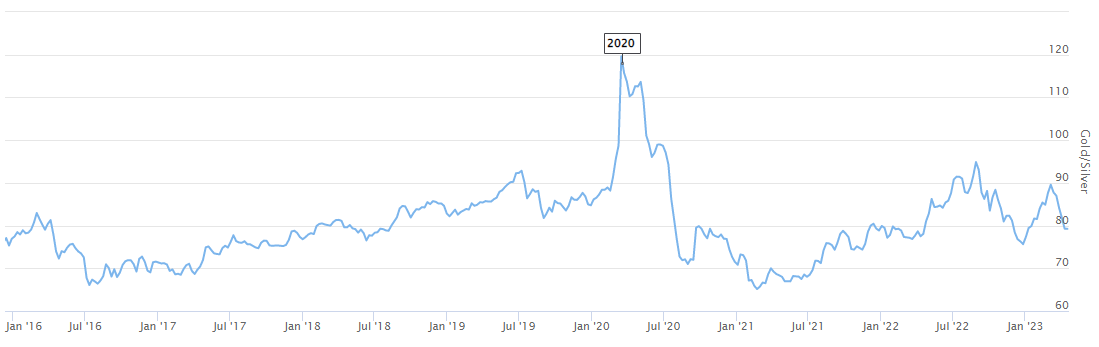
Gold is currently moving in a narrow range of $1960-2000 per ounce, and silver is at $25. Using these figures, we calculate the gold-silver ratio to be 80, which means that gold is currently 80 times more expensive than silver. This striking disparity in value is a notable departure from the historical range of 45–30 to 1.
By watching market trends and the myriad factors shaping the prices of these precious metals, two things become clear:
- A recession is imminent in the US, and most likely in the EU. The US Conference Board compiles a special index that includes the ten most statistically significant indicators of the nation's economy. Together, they have an unrivaled 100% hit rate and point to upcoming inflation.

Source: The Macro Compass, November 23, 2022.
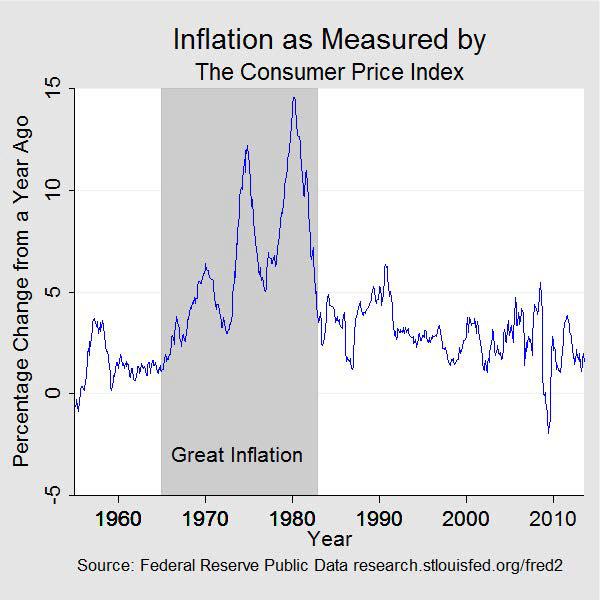
- Inflation is decreasing now, but the experience of inflation spikes in the 1970s reminds us that there is still a lot to be concerned about. Deglobalization, which has already started, may push oil prices higher, boosting the US PMI index.
Source: federalreservehistory.org
Investment Considerations
The above points to the high probability of a wild ride for XAUUSD amid the weakening dollar. The metal may soar above its all-time high of $2070 and reach the distant targets of $2300 and $2500.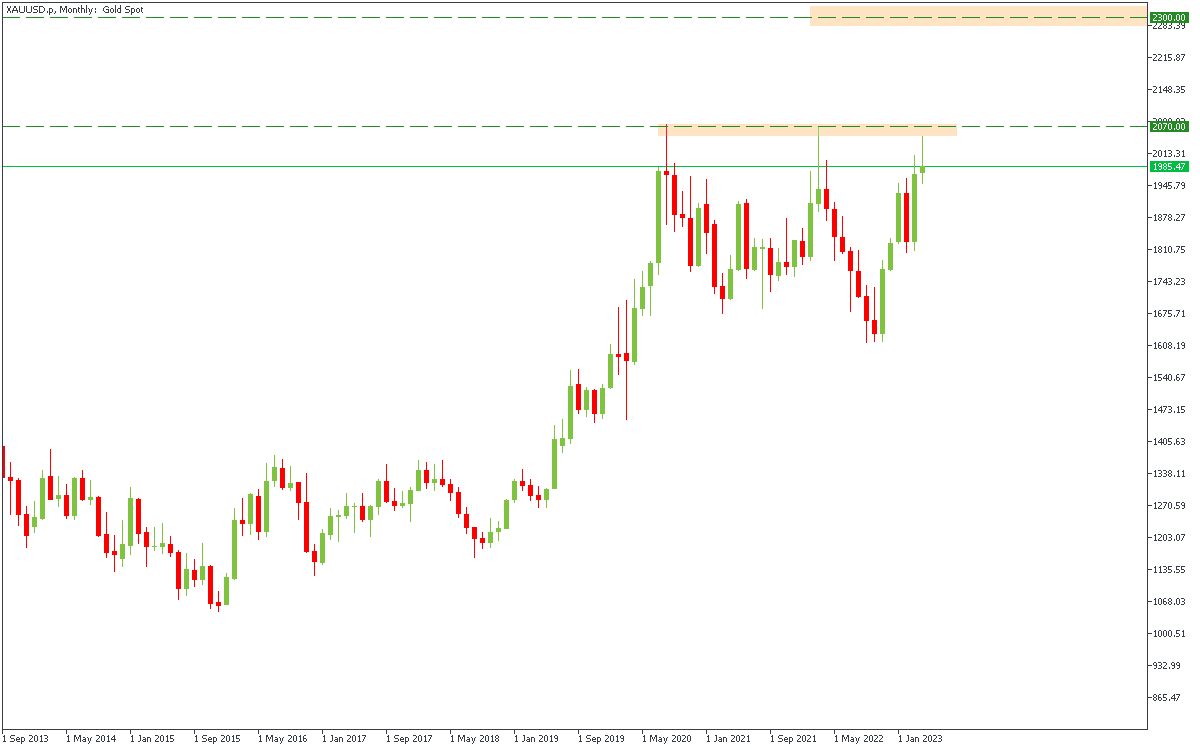
As we have mentioned, silver has historically acts as a lagging indicator for gold, providing enough time for investors to pour their money from the more stable gold, into the volatile and likely undervalued silver. It’s almost like Ethereum and Bitcoin. The early bird gets the worm during so-called altseason, which can begin quite soon for the metals.
A reversion of the gold-silver ratio to its historical levels could signal an accelerated rise in silver prices compared to gold. Therefore, XAGUSD may be a great choice for investors who can afford more risks and are ready to wait several years for the price deviation to collapse. In a nutshell, we think silver is relatively undervalued and may outperform the market over 2023-2025. The $31.9 and $39.64 levels represent 30% and 62% growth, respectively.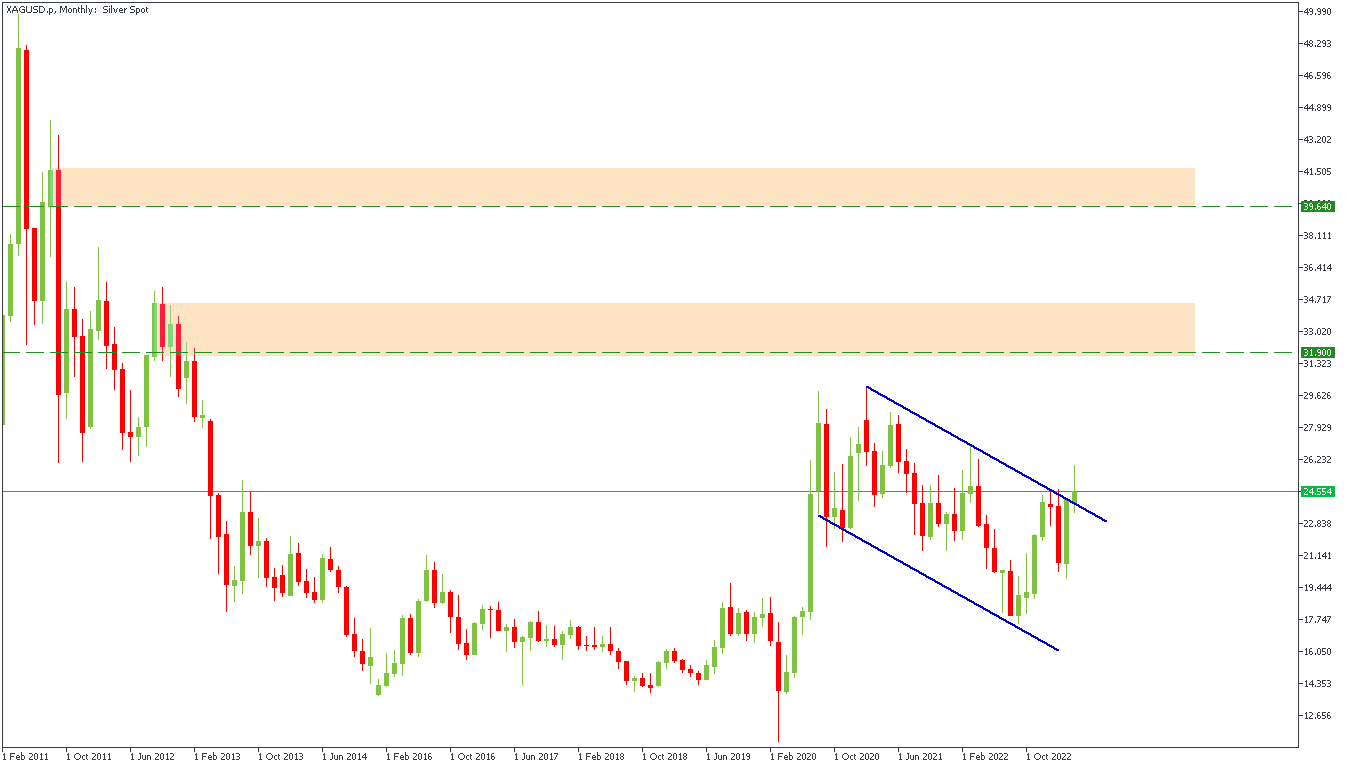
Summary
The gold-silver ratio (GSR) has averaged 40-50 since 1950, but has recently reached 80. The current GSR suggests that silver may be undervalued compared to gold, offering potential opportunities for investors comfortable with waiting several years for the change to occur. FBS expects silver to reach $31.9 as a conservative target and $39.64 in the event of extra-bullish cases for the metal.
***
FBS is an international brand present in over 150 countries. Independent companies united by the FBS brand are devoted to their clients and offer them opportunities to trade Margin FX and CFDs.
FBS Markets Inc. – license IFSC/000102/310Tradestone Ltd. – CySEC license number 331/17, FCA temporary permit 808276Intelligent Financial Markets Pty Ltd – ASIC Licence number 426359