With U.S. markets off-line for MLK day, the break has given investors a chance to catch their breath after a vast improvement in global financial conditions really since 26 December.
With Asia ramping back up, we have seen S&P 500 futures resume trade, 0.6% lower, and while we saw the S&P 500 close near its highs on Friday, this move in futures could be quite telling, and it feels as though this could be a good place to lighten up on longs here. It’s somewhat premature to suggest shorts on any key indices yet, as price is still trending higher. However, after this 14% rally since 26 December, the U.S. market is overbought here and in a game of probabilities, I see growing risks of a near-term peak and potential reversal. Should it play out, it will flow through to other global indices.
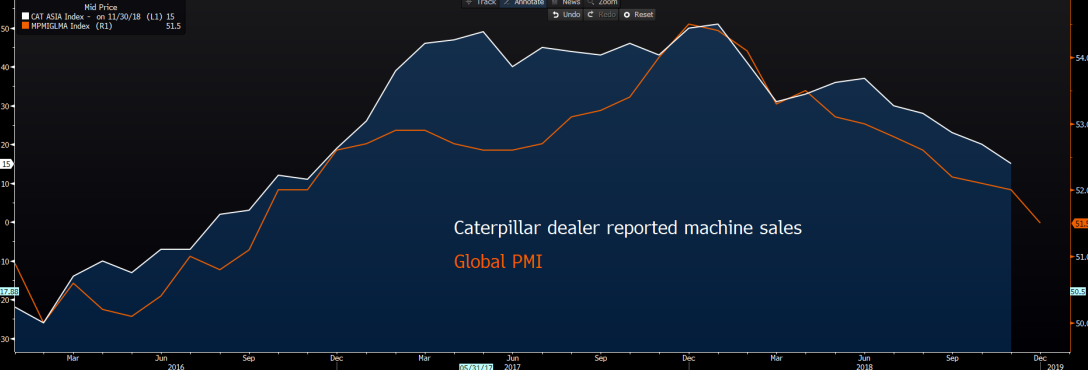
U.S. corporate earnings will play a role in the near-term direction, and specifically, I would be looking at Caterpillar’s (NYSE:CAT) numbers tomorrow. Here, we can see a strong correlation between CAT's dealer reported machine sales and the global PMI series, which, in turn, are highly correlated to global equity markets. After such a brutal drawdown in risk assets in Q4 '18, the transparency investors gain from corporate reporting, and the ability to mark-to-market the environment corporates operate in relative to the dynamics the market has priced is huge. Corporate reporting allows us to have greater confidence that the ‘E’ (earnings) side of the P/E equation is even remotely accurate.

When so many global equity markets are trading on ‘cheap’ valuations, the concern, of course, is the degree of risk premium we need to consider given the macro environment, and the associated opportunity costs (think ‘real’ U.S. Treasury yields). We also need to have confidence in the ability to forecast earnings, and in fast moving, volatile markets, we simply lose faith in the required assumptions and models become almost irrelevant. Earnings reporting season allows analysts to claw back some confidence in their operating environment and one would argue this is helping to lower implied volatility, for now anyhow.
Liquidity, money supply and fund flow
Much ink has been spilled on how excess liquidity (driven by changes in the Fed’s balance sheet), money supply and fund flows have sucked the life out of equity and credit markets, not to mention impacting the USD. With that in mind, we can see after a period in mid-December, where the pace of declines in excess reserves abated, and global money supply increased, sentiment towards risk assets was less negative - this trend is now reversing. Does this mean we are set for higher volatility again and renewed bearish exposures? Price will tell.


German DAX - who says equities don't reflect economics?
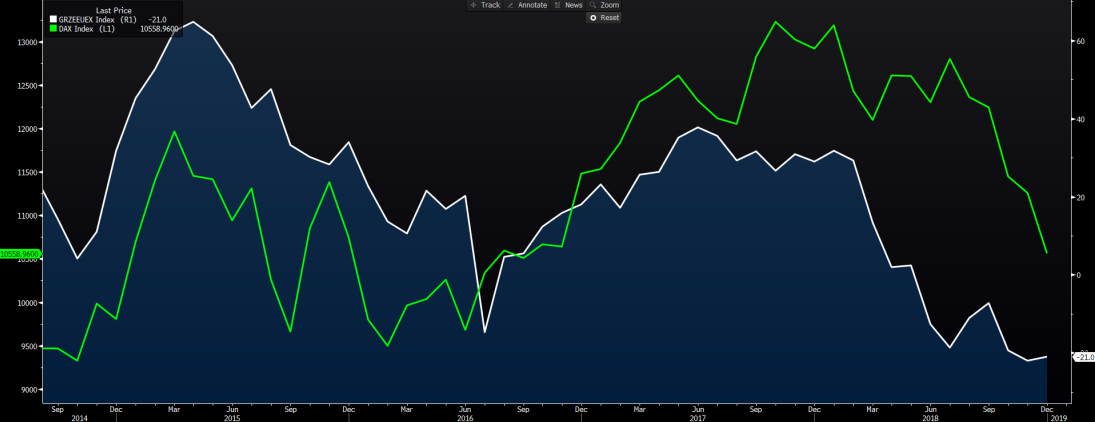
Staying in the equities space, I will be keeping an eye on the German DAX, which gapped through 11,000 last week on higher volume. A bullish move, but as we have seen for the past five years or so, the DAX is one of the most correlated to domestic, not to mention Chinese economic performance. With the EU and German ZEW survey in play, a further deterioration in the expectations survey should weigh on the index. I had been expecting a move into the June 2018 downtrend at 11,780, but my conviction behind this call is diminishing, and naturally, exposures need to be managed accordingly.
There is no survey for traders to ascertain expectations, and while there are signs of stabilization in this data point, it would not surprise to see this index drop from the current read of -21 and towards the weakest reads since 2011. Recall, we still have the EU PMI data, and ECB meeting through this week, so the DAX should get renewed focus from traders. We also will be focused on EURUSD, which has traded in a whopping 21-point range in the last 12 hours. On the day, I am a willing buyer of EURUSD into $1.1320 (the lower Bollinger® band), and given overnight implied vols highlight an implied move of 44-points (on the session), my order seems a punchy call. On the upside, I would look to fade EURUSD strength into 1.1420.

Eyeing today’s session so far—and it’s been one to forget—with little moves in G10 FX, while copper futures are 1.6% lower, although Chinese and Hong Kong markets are around 0.7% lower. The ASX 200 is 0.6% lower, with the financial sector down 1.3% lower, with the sector promoting a sizeable 24-point headwind for the local market. There are signs of rotation into defensive sectors of the market with small buying in utilities and health care, while it should be noted that volumes are pretty woeful and some 33% below the 30-day average (for this time).
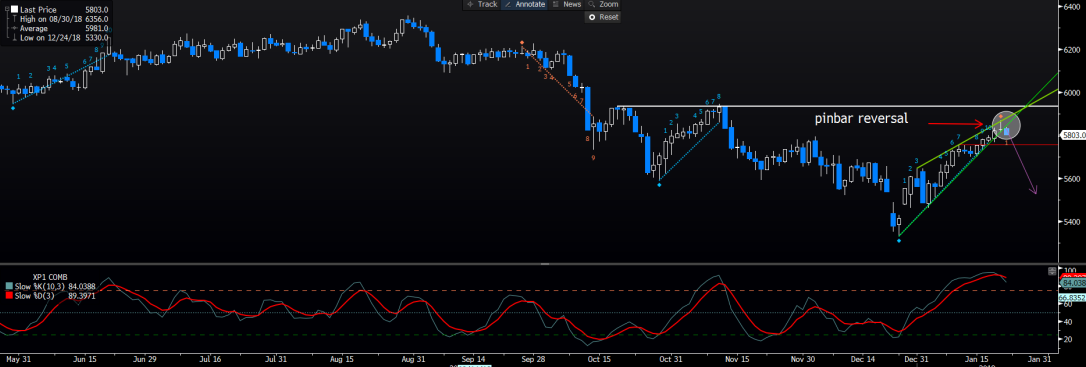
Aussie SPI futures look an interesting guide for those focusing on the ASX200, with price eyeing a more convincing break of yesterday’s pin bar reversal low (5814) and rising wedge pattern. This argues for a deeper reversal, and we can also see stochastic momentum holding a bearish crossover. I am looking for a move into 5756 (potentially even 5520), where we may see the bulls look to support. However, as always, we trade price and probabilities, so the preference is to react to behavior around expected support levels.

In FX markets, we saw GBPUSD temporarily push above 1.29, but the positive flows have had to contend with a further barrage of Brexit related headlines. Jeremy Corbyn endorsing a plan for MPs to have a say on a second referendum has been a focal point, a fate the betting markets place at around 38% at this juncture (source: Oddschecker). Indeed, it seems something is brewing in the Commons that will involve MPs actually having a say on what they want, and not what they don’t want to see, and if we are truly going to see progress, then it needs to evolve through next week.
Observing from the other side of the world, it seems that UK politics is genuinely broken, and there is no such thing as right and left politics, just Brexit or Remain, and differing degrees of this.
AUDUSD has also held a tight range, but the risks are skewed to the downside in my opinion. The market should start to focus on the 5 February RBA meeting, and whether the RBA statement moves closer to the 46% chance of a cut currently priced over the coming 12 months in the swaps market. We get Aussie jobs on Thursday local time, with NAB business confidence and Q4 CPI next week. These could be influential on whether the RBA offers a more dovish assessment on policy. The move implied from options pricing (expiring 5th February) is 104-points from the current spot, and while there is time premium involved here, the market sees the move capped into 0.7050 to 0.7250…is this fair?
