
Shares of Signet Jewelers Limited (NYSE:SIG) declined roughly 18% during the trading session on Dec 6. This was mainly due to adjusted loss reported in third-quarter fiscal 2019 results, which may have hurt investors’ sentiments. We note that in the past month, the company’s shares have slumped 31.8% compared with the industry’s decline of 20%.

Nevertheless, both bottom and top lines surpassed the Zacks Consensus Estimate in the reported quarter. Performance was mainly driven by growth in same-store sales.
Q3 Details
The company reported adjusted loss of $1.06 per share in the quarter, which was narrower than the Zacks Consensus Estimate of a loss of $1.08. Also, the same declined more than five folds compared with the year-ago quarter’s loss of 20 cents.
This jewellery retailer generated total revenues of $1,191.7 million that came ahead of the Zacks Consensus Estimate of $1,172 million and rose 3% year over year. On a constant-currency basis, revenues increased 3.3%.
Per management, sales were primarily driven by strong same-store sales performance, the James Allen acquisition in September 2017 and the application of new revenue recognition accounting standards. These upsides were partly negated by unfavourable currency, impacts stemming from calendar shifts and store closures.
This Zacks Rank #3 (Hold) company’s same-store sales rose 1.6% year over year. E-commerce sales, including James Allen, came in at $125 million, up 54.9% on a year-over-year basis. We note that e-commerce improved across all channels in the quarter and accounted for 10.5% of total sales.
Adjusted gross profit increased 15.6% to $371.2 million, while gross margin expanded 330 basis points (bps) to 31.1%. Selling, general and administrative expenses (SG&A) were up 9.2% to $410.3 million in the quarter, owing to higher advertising expenses, rising incentive compensation and increasing credit outsourcing costs that were partly offset by cost savings. Adjusted operating loss came in at $38.9 million, against operating income of $5.5 million in the year-ago quarter.
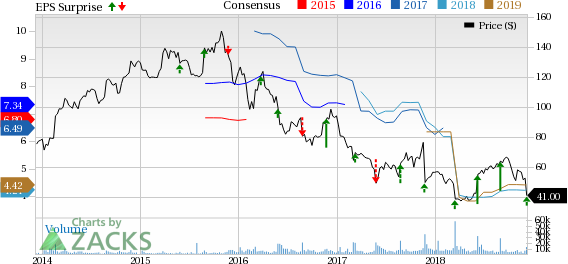
Signet Jewelers Limited Price, Consensus and EPS Surprise
Segment Discussion
Sales at the North America segment increased 4.1% on a reported basis (or 4.3% at constant currency basis) to $1,064.3 million. Comps rose 2.1% on the back of James Allen’s contribution to sales and renewed focus on product assortment.
Further, comps increased 2.8%, 16.2% and 0.7% in Zales, Piercing Pagoda and Kay segment, respectively, while it remained flat for Jared.
Sales at the International segment decreased 5.5% to $121.3 million on a reported basis and declined 4.2% on a constant-currency basis. Comps at the segment declined 3.1%, along with flat ATV and a transaction decline of 2.7%. Dismal comps performance mainly stemmed from soft-traffic trends and a tough consumer environment. Further, lower sales of diamond jewellery and fashion watches were partially offset by higher prestige watch sales.
Other Details
Signet ended the first quarter with cash and cash equivalents of $130.7 million, net accounts receivable (inclusive of accounts receivable held for sale) of $14.1 million and inventories worth $2,647.1 million. Long-term debt and total shareholders’ equity were $660.4 million and $1,349 million, respectively.
For fiscal 2019, the company plans to close more than 200 stores and open approximately 30 stores. As of Nov 3, the company operated 3,478 stores.
The company has repurchased 8.8 million shares worth approximately $485 million year to date. As of Nov 3, the company is left with share repurchase authorization of $165.6 million.
Guidance
Management revised its guidance for fiscal 2019. The company anticipates earnings per share between $4.15 and $4.40 compared with its prior guidance of $4.05-$4.40. The Zacks Consensus Estimate for fiscal 2019 is pegged at $4.22.
It now expects same-store sales to be flat to up 1% compared with the prior view of flat to down 1.5%.
Sales for the year is projected to be $6.26-$6.31 billion compared with the previous projection of $6.2-$6.3 billion. The company continues to anticipate capital expenditures of $165-$185 million.
Signet also provided fourth-quarter fiscal 2019 guidance. The company anticipates adjusted earnings per share of $4.35-$4.59. Sales are projected to be $2.17-$2.22 billion. Further, gross margin rate and SG&A expenses are expected to increase year over year in the quarter.
Earlier in March 2018, the company announced its three-year Path to Brilliance transformation plan. In this regard, Signet continues to anticipate cost savings of $85-$100 million during fiscal 2019 with additional cost savings of $115-$125 million by the end of the three-year program. Additionally, the company continues to project cost savings from this program to be $200-$225 million over the next three years.
Interested in the Retail Space? Check These
Boot Barn Holdings, Inc. (NYSE:BOOT) has long-term earnings growth rate of 23% and a Zacks Rank #1 (Strong Buy). You can see the complete list of today’s Zacks #1 Rank (Strong Buy) stocks here.
Canada Goose Holdings (NYSE:GOOS) has long-term earnings growth rate of 31.3% and a Zacks Rank #2 (Buy).
Foot Locker, Inc. (NYSE:FL) has long-term earnings growth rate of 7.5% and a Zacks Rank #2.
Today's Stocks from Zacks' Hottest Strategies
It's hard to believe, even for us at Zacks. But while the market gained +21.9% in 2017, our top stock-picking screens have returned +115.0%, +109.3%, +104.9%, +98.6%, and +67.1%.
And this outperformance has not just been a recent phenomenon. Over the years it has been remarkably consistent. From 2000 - 2017, the composite yearly average gain for these strategies has beaten the market more than 19X over. Maybe even more remarkable is the fact that we're willing to share their latest stocks with you without cost or obligation.
Foot Locker, Inc. (FL): Free Stock Analysis Report
Canada Goose Holdings Inc. (GOOS): Free Stock Analysis Report
Signet Jewelers Limited (SIG): Free Stock Analysis Report
Boot Barn Holdings, Inc. (BOOT): Free Stock Analysis Report
Original post
Zacks Investment Research