Get 40% Off
⚠ Earnings Alert! Which stocks are poised to surge?
See the stocks on our ProPicks radar. These strategies gained 19.7% year-to-date.
Unlock full list

The Relationship Between Gold And The S&P 500

Published 05/20/2016, 02:42 AM
Updated 07/09/2023, 06:31 AM

Thanks to High Frequency Trading and the rise of the machines in the electronic markets, gold and the S&P 500 Index are difficult for non-machines to understand and predict on a short term basis.

What do they tell us in the longer term?

It is an exponentially increasing world! Both gold and the S&P 500 Index have risen exponentially for fifty years. Since they often move counter to each other, take the sum of the gold price plus the S&P 500 Index and you can see the overall trend more easily.
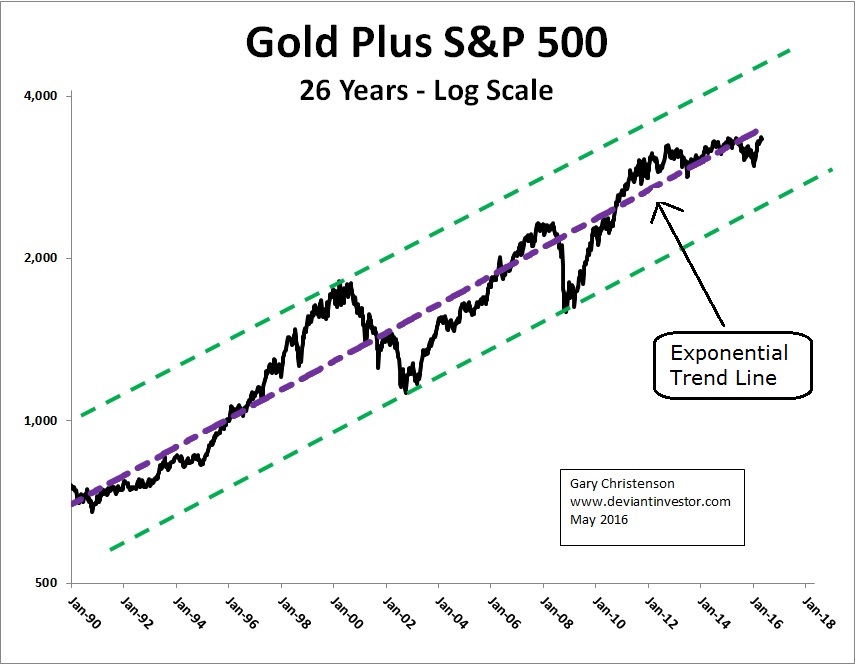
Gold Plus S&P 500 Chart

The exponential trend since 1990 is clear. We can reasonably expect they will continue to rise until we experience a massive reset in the financial systems.

What about the RATIO of gold to the S&P 500 Index?
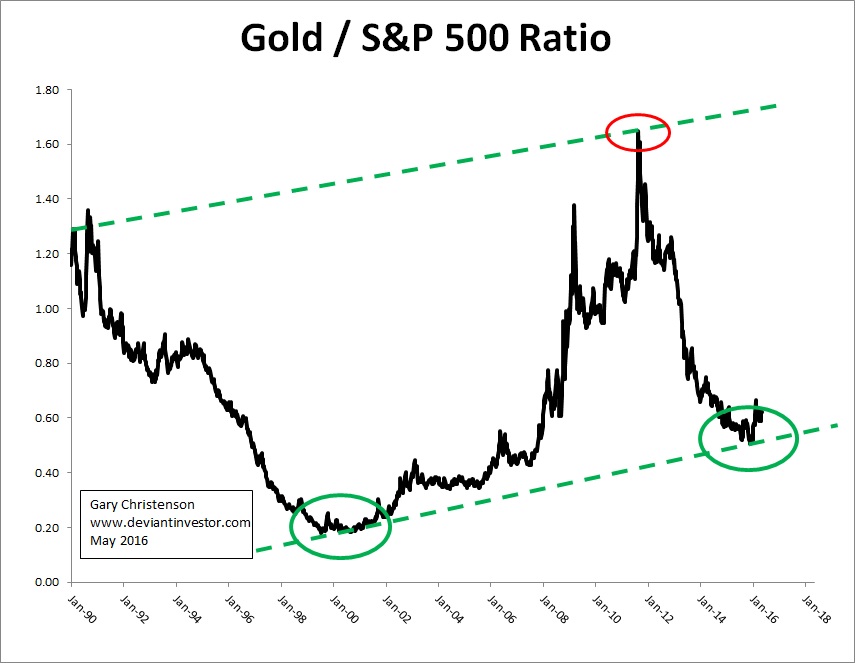
Gold - S&P Ratio

Since 1990 the ratio (weekly data) has varied widely, from under 0.20 to 1.60. The two low points in the ratio are marked with green ovals, and the high point in 2011 is marked with a red oval.

Conclusion: At green ovals buy gold and sell the S&P. At red ovals sell gold and buy the S&P.

What about actual gold prices?
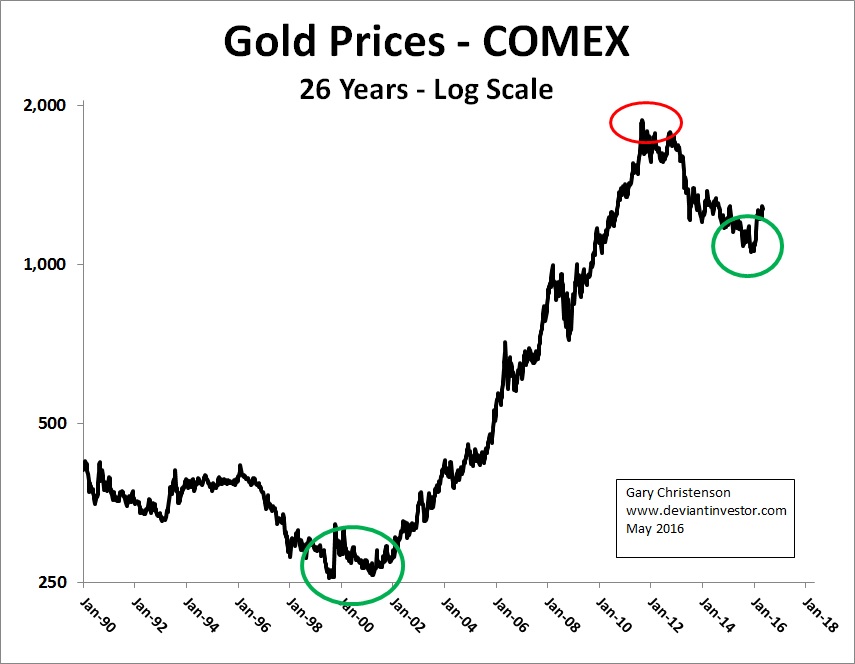
Gold - S&P COMEX

The above gold chart – log scale since 1990 – supports those conclusions. At green ovals, which are the same ovals as on the ratio chart, buy gold and at red ovals sell gold.

SUMMARY:

  • Prices for gold and the S&P 500 rise exponentially. We can thank central banks, runaway debt, continual currency devaluations, and fractional reserve banking, but regardless, expect those exponential increases to continue until the financial system experiences a major reset.
  • The ratio of gold to the S&P 500 Index is currently low, consistent with the fact that gold hit a multi-year low in December 2015. The ratio can easily triple from here.
  • Green ovals indicate long-term opportunities to buy gold and probably to sell the S&P 500 Index.
  • Do your own research, but based on the above charts, 2016 looks like a good time to accumulate more gold for the long term. When the gold to S&P 500 Index ratio approaches 1.2 – 1.6, reconsider both markets.
  • Expect: More currency devaluations, higher prices for commodities, volatile markets, increasing central bank desperation as shown by craziness such as negative interest rates, more QE, and continued zero-interest rate policy. Central banks do NOT have your back – unless you are a member of the political and financial elite.

Latest comments

You clearly do not know what exponential means. what you have drawn are 3 straight lines, not half parabolas.
Actually, since the chart is on a log scale, a straight line is equivalent to an exponential increase on a linear scale.
Risk Disclosure: Trading in financial instruments and/or cryptocurrencies involves high risks including the risk of losing some, or all, of your investment amount, and may not be suitable for all investors. Prices of cryptocurrencies are extremely volatile and may be affected by external factors such as financial, regulatory or political events. Trading on margin increases the financial risks.
Before deciding to trade in financial instrument or cryptocurrencies you should be fully informed of the risks and costs associated with trading the financial markets, carefully consider your investment objectives, level of experience, and risk appetite, and seek professional advice where needed.
Fusion Media would like to remind you that the data contained in this website is not necessarily real-time nor accurate. The data and prices on the website are not necessarily provided by any market or exchange, but may be provided by market makers, and so prices may not be accurate and may differ from the actual price at any given market, meaning prices are indicative and not appropriate for trading purposes. Fusion Media and any provider of the data contained in this website will not accept liability for any loss or damage as a result of your trading, or your reliance on the information contained within this website.
It is prohibited to use, store, reproduce, display, modify, transmit or distribute the data contained in this website without the explicit prior written permission of Fusion Media and/or the data provider. All intellectual property rights are reserved by the providers and/or the exchange providing the data contained in this website.
Fusion Media may be compensated by the advertisers that appear on the website, based on your interaction with the advertisements or advertisers.
© 2007-2024 - Fusion Media Limited. All Rights Reserved.