Momentum and market psychology are more powerful than fundamentals.
Yesterday's correction was simply taking back some of the silliness traders priced in as fundamentals were disregarded. Coronavirus is a convenient excuse, but the sell-off should have happened regardless of the news. As we have been stating, when the masses assume there is no risk in being in the stock market, something has to give. And that something is usually a rude awakening in the form of a sharp correction.
A few weeks ago we noted the large long position being amassed by the "asset manager" category of the COT Report. According to the latest CFTC report, Asset Managers were holding just over 1.1 million net-long futures. We’ve noticed any time this group amasses a position in excess of a million contracts, the market gets toppy. In recent occasions, market corrections were relatively substantial.
▪February 2018 – ES dropped 340 points (2975 to 2530) – 11.4%
▪October 2018 – ES dropped 635 points (2950 to 2315) – 21%
▪August 2019 – ES dropped 250 (3030 to 2780) – 8%
If history tells us anything, the ES could correct at least 250 to 400 points from the recent high and possibly more if concerns over BOTH coronavirus and the upcoming election heat up. To put this into perspective, an 8% correction equates to 272 points and a 12% decline would mean 400 points in the S&P.

30-year Treasury Bond Futures
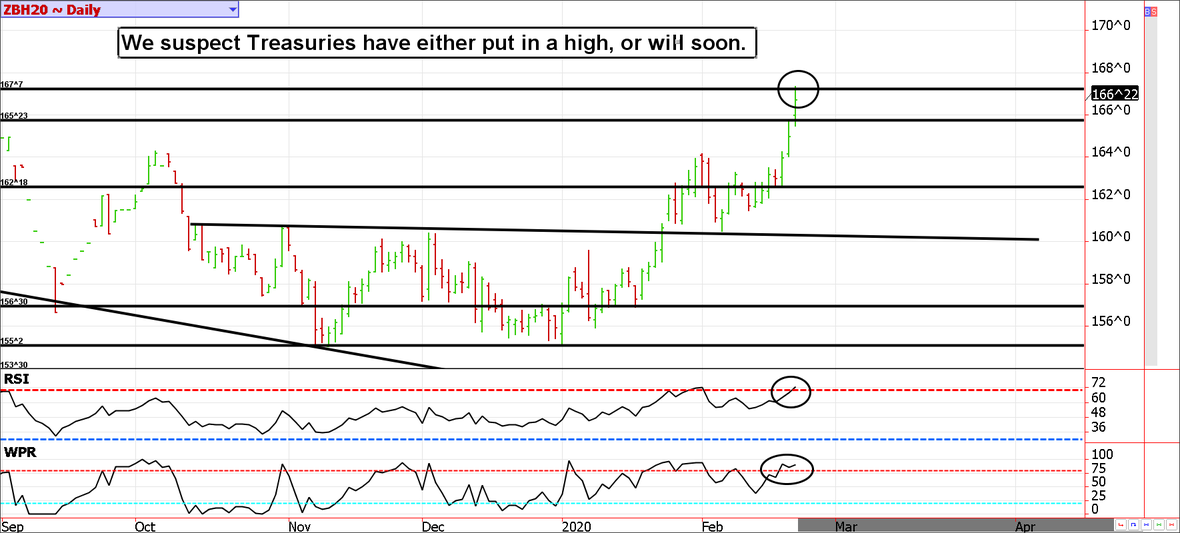
167'09 in the ZB held, that might have been the last hurrah.
If you are a bond bear, it is probably time to start nibbling on positions. Although we will likely see swift volatility in the coming sessions, the long-term prospects for continued gains aren't necessarily great.
It is hard to believe, but the market is pricing in 2 Fed rate cuts and partially pricing in a third cut! We highly doubt that this will be the case. If you agree, a lower risk way to get a foot in the door is to sell a September Eurodollar futures contract. The margin is low and it generally doesn't move enough to cause significant harm.
Treasury futures market consensus:
167'09 resistance held the first time up, the market should start getting heavy from here.
Technical Support: ZB : 162'18, 160'03, 156'30, 155'02 and 153'30 ZN: 130'06, 128'23, 128'00, 127'08, 126'06.
Technical Resistance: ZB: 167'09 and 168'01 ZN: 133'0 and 134'11
Stock Index Futures

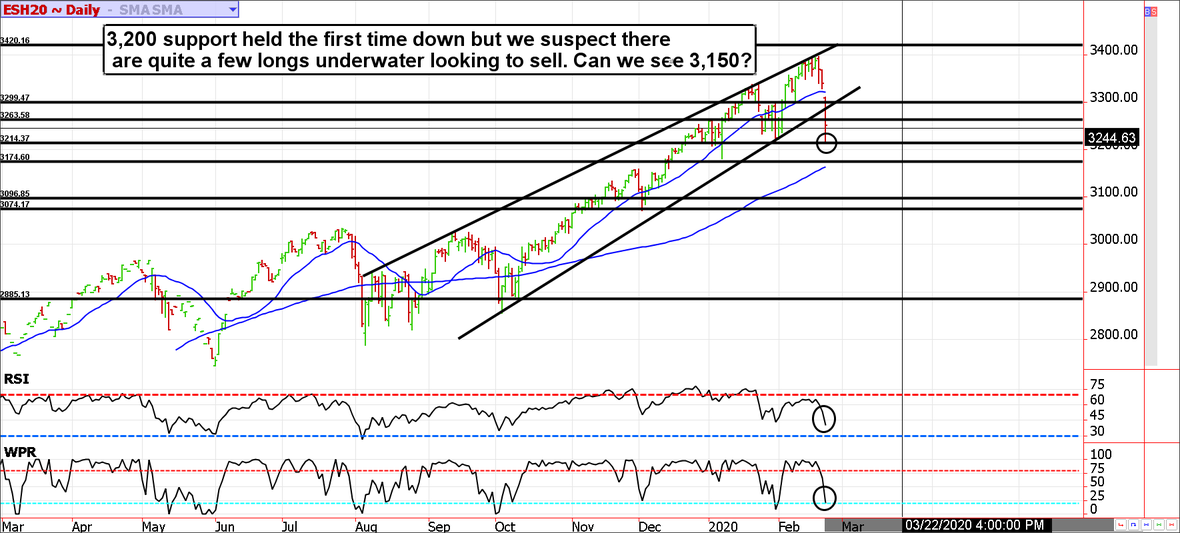
Finally, the ES is correcting.
Yesterday felt like a massive sell-off, but it merely puts the market back to where it started the month. Further, we are still arguably overvalued on most respects. Yesterday's 3.5% decline put the S&P only 5% below all-time highs. Again, some pundits were talking about picking bottoms but we aren't sure it is going to be that easy this time.
There are likely quite a few traders caught on the wrong side of this and looking for a place to sell. After all, speculators and investors have been complacently long. If they continue to liquidate we could see prices in the mid-3,100s in the coming days. However, believe it or not, a proper correction would need to print below 3,000. Our weekly chart analysis suggests 2950 to 2800 would be normal ebb and flow. To put this into perspective, this would be a 13% correction. It shouldn't be seen as scary, it should be seen as normal.
Stock index futures market consensus:
Prices should see another round of selling to bring the E-mini S&P below 3,200 (to 3,150).
Technical Support: 3210, 3182, 3164, 3074, 2885
Technical Resistance: 3322, 3405 and 3425
E-mini S&P Futures Day Trading Ideas
These are counter-trend entry ideas, the more distant the level the more reliable but the less likely to get filled
ES Day Trade Sell Levels: 3304 (minor), 3341, 3364, and 3376
ES Day Trade Buy Levels: 3208, 3191, and 3164
In other commodity futures and options markets...
September 12 - Roll the September Bloomberg Commodity Index into the December contract.
December 13 - Roll the December Bloomberg Commodity Index into March.
February 21 - Exit half of the Bloomberg Commodity Index futures position (we added on a dip in January).
June 14 - Roll BCI into the September contract and double the quantity (to dollar cost average).
July 25 - Go long the euro currency using a micro futures contract.
September 25 - Buy January orange juice 110 calls for about 2.50 ($375).
October 28 - Sell S&P 500 futures in a SMALL way using Micro E-mini or E-minis depending on account size and risk tolerance.
November 7th - Add to micro ES short future position (double the current quantity).
December 3 - Offset half of the short S&P positions.
December 4 - Offset cattle spread to lock in moderate loss (about $300 for most before transaction costs).
December 9 - Roll December euro into March.
December 9 - Roll December BCI into March.
December 13 - Roll December Micro E-mini S&P into March and double the quantity.
January 3 - Go long mini natural gas futures near $2.10.
January 8 - Sell April crude oil 69/52 strangle and buy the March 73/50 strangle to act as catastrophic insurance for a net credit of about $930 before transaction costs.
January 15 - Sell April hog 66 puts and buy February hog 60 puts for a credit of about $700 before transaction costs.
January 15 - Buy back short call leg of crude oil spread to lock in gain of about $600 to $700 (we are holding the rest of the trade).
January 16 - Go long May corn, hedge the position by purchasing a May 3.70 puy and paying for it with the sale of a May 4.10 call.
January 15 - Sell May wheat 6.20 call and buy the March 6.30 call to collect about 12 cents.
January 27 - Buy March soybean 9.10 calls near 5 cents.
January 31 - Exit short wheat call spread to lock in a quick gain.
January 31 - Offset half of the micro ES futures near 3255.
February 5 - Roll Feb hog 60 put into a 57 put to lock in a gain on the insurance while keeping a hedge in place.
February 10 - Roll March crude oil 50 put into the 48.50 to lock in a gain on the hedge and reduce theta risk.
February 12 - Sell April 55 crude oil call and buy a Feb week 4 57 call as a hedge.
February 13 - Roll Feb 57 hog put into an April 56 put.
February 14 - Buy Feb week 4 crude oil 47 put to replace the expiring protection.
DeCarley Trading (a division of Zaner)
Due to time constraints and our fiduciary duty to put clients first, the charts provided in this newsletter may not reflect the current session data.
Seasonality is already factored into current prices, any references to such does not indicate future market action.
There is substantial risk of loss in trading futures and options.
* These recommendations are a solicitation for entering into derivatives transactions. All known news and events have already been factored into the price of the underlying derivatives discussed. From time to time persons affiliated with Zaner, or its associated companies, may have positions in recommended and other derivatives. Past performance is not indicative of future results. The information and data in this report were obtained from sources considered reliable. Their accuracy or completeness is not guaranteed. Any decision to purchase or sell as a result of the opinions expressed in this report will be the full responsibility of the person authorizing such transaction. Seasonal tendencies are a composite of some of the more consistent commodity futures seasonals that have occurred over the past 15 or more years. There are usually underlying, fundamental circumstances that occur annually that tend to cause the futures markets to react in similar directional manner during a certain calendar year. While seasonal trends may potentially impact supply and demand in certain commodities, seasonal aspects of supply and demand have been factored into futures & options market pricing. Even if a seasonal tendency occurs in the future, it may not result in a profitable transaction as fees and the timing of the entry and liquidation may impact on the results. No representation is being made that any account has in the past, or will in the future, achieve profits using these recommendations. No representation is being made that price patterns will recur in the future.
