by Dr. Heinrich Leopold
If you believe the recent surge in U.S. oil production suggests that good times are here once more, think again. While the U.S. oil industry continues to increase production by adding a great deal more drilling rigs, there is serious trouble taking place in the shale patch that very few are aware. This has to do with the rapid deterioration of oil and gas economics as horrendous decline rates eat into company cash flows.
The Economics Of Oil & Gas Production
The advent of shale oil and gas production, which created the vision of ‘ US energy independence’ , has brought renewed interest in the economics of oil and gas production. What are the key parameters for productivity and costs?
In short, it is the cost per produced barrel and not – as often referred in the media – the absolute cost per individual well.
To demonstrate my point, I want to use a standard well which costs $10 million to drill and produces initially 200 barrels per day as a simple example. The costs of $10 million tells very little, as the most important fact is how much this well can produce over its lifetime. Assuming a 10 year life span and implying a 5-10% yearly decline rate – which is the standard for a conventional well – , the well produces roughly 500,000 barrels during its life. This gives then the drilling cost of $20 per produced barrel. Maintenance, taxes, license, transportation… have to be added and divided by the amount of produced barrels. This gives then a production cost of roughly $40 per barrel. This is the standard model of a conventional oil well. In theory, the true cost can only be determined when a well is shut down and the actual amount of produced barrels is known. Therefore, all of the studies for production cost are guesstimates as they are based on an estimate about future oil production of the wells.
If now the life span of a well is much shorter than the above standard well – say for the sake of simplicity – just five years implying a yearly decline rate of 10-20 %, the amount of produced barrels sinks to 250,000 barrels and the drilling cost increases to $40 per barrel and the total cost surges towards $80 per barrel. This comes despite the drilling cost as well as the maintenance, overhead, … are the same as in the above example.
As a conclusion, the true costs are strongly dependent on the life span (or the yearly decline rate – referred to very often as ‘legacy’ rate) of the well. So, if a company boasts it has decreased its drilling costs from $10 million per well to $8 million per well, it is just half of the truth as the well may decline much faster and thus produce less oil over its life span and the drilling cost per barrel could be actually much higher, despite the reduction in costs per well.
And this is exactly what is currently happening in the shale patch. Despite considerably lower costs per well, the wells decline much faster and thus the costs per produced barrel are spiraling accordingly.
As it is difficult to assess the future performance of wells, we can luckily see a trend from the history of performance from existing wells. In its monthly drilling report, the EIA publishes the performance of new oil and gas wells versus existing wells. This gives an excellent insight into the status of the shale industry.
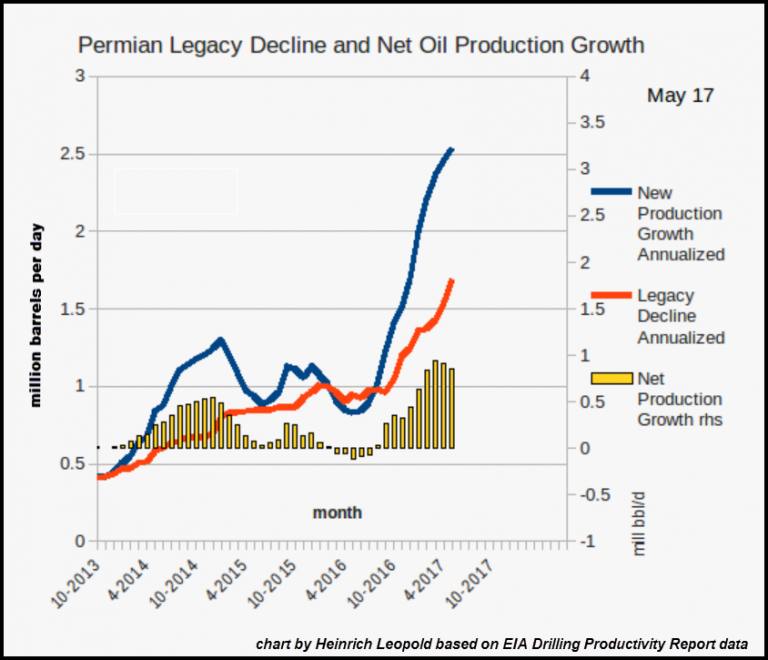
Below chart 1 depicts the addition of new wells (blue line) in the Permian versus the legacy decline of existing wells (red line) and the resulting net growth for the field in million barrels per day (yellow bars right hand scale).
The massive addition of nearly 2.5 million barrels per day and year of new production (blue line) is mitigated by the already equally monstrous decline of existing wells (red line). Furthermore, chart 1 shows a fast growing legacy decline rate, which is actually growing faster than the addition of new production. Therefore, the monthly production growth has been already decreased over the last two months. As a strongly rising decline rate reduces cash flow of companies very swiftly, I expect new production will decline considerably over the next few months.

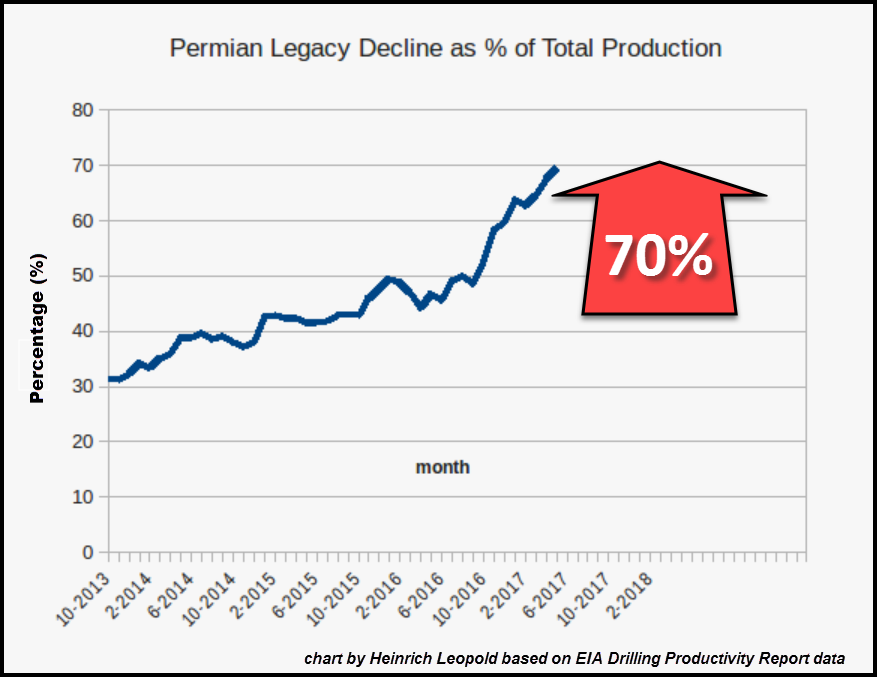
As chart 1 shows, there is still considerable growth left in the Permian. However, as the legacy decline rate increases now very fast, the decline rate as percentage of total production rises accordingly as shown in chart 2. The ratio of legacy decline versus total production increased from 0.3 (or 30% decline) towards 0.7 – or 70% percent decline over the latest few years.

This implies the wells in the Permian have just a few years life span left. After what has been said in the introduction of this article, this means nothing else than the economics of Permian wells have dramatically deteriorated, more than doubling the cost per produced barrel over the last few years. This is, however, mitigated by lower drilling cost per well, which admittedly took place over the last years, yet the overall picture is that of a strongly rising cost structure in the Permian and other shale oil and gas fields which should give much concern for investors and shareholders.
