EU and US indices rebounded yesterday, perhaps due to optimism over the COVID-19 vaccination programs and a large stimulus package in the US.
That said, the joy did not last for long, as Asian indices declined again.
As for today, the main items on the economic agenda may be Eurozone’s CPIs for February and Canada’s GDP for December and Q4 as a whole.
EU And US Equities Rebound, But Asian Ones Slide
The US dollar traded higher against the majority of the other G10 currencies on Monday and during the Asian session Tuesday. It gained the most versus CHF, GBP, and EUR in that order, while it lost some ground only against NOK and CAD. The greenback was found virtually unchanged versus AUD.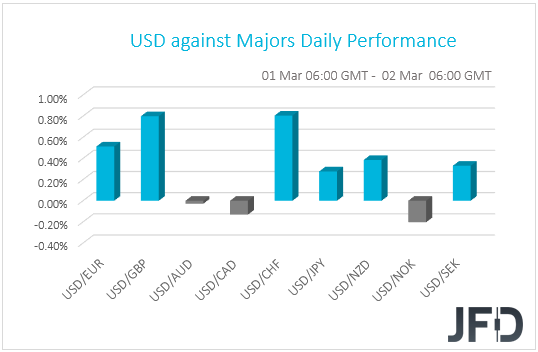
The strengthening of the greenback suggests that markets continued trading in a risk-off fashion on Monday and today in Asia. However, the weakening of the safe-haven franc points otherwise. Thus, in order to get a clearer picture with regards to the broader market sentiment, we prefer to turn our gaze to the equity world.
There, major EU and US indices were a sea of green with the main gainer being NASDAQ, which enjoyed its best trading session in a month. However, market sentiment deteriorated again during the Asian session today, with Japan’s Nikkei 225 and China’s Shanghai Composite sliding 0.86% and 1.21% respectively.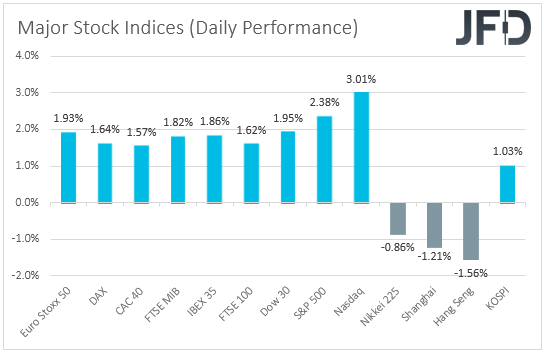
The rebound in EU and US stocks coincided with a pullback in bond yields, and it may have been the result of optimism over the coronavirus vaccination programs and a large US fiscal stimulus package.
Johnson & Johnson (NYSE:JNJ) began shipping its single-dose vaccine after it was authorized by the US over the weekend, while President Joseph Biden’s USD 1.9trln relief package passed through the House of Representatives. The bill now moves to the Senate.
What may have also helped market sentiment is the upside revisions in the Markit manufacturing PMIs from the Eurozone, the UK and the US, as well as the fact that the US ISM manufacturing index increased to a three-year high. However, the joy did not last for long, with yields rebounding and equities pulling back during the Asian session today.
It seems that investors are still concerned that the economic recovery will lead to higher inflation, which may in turn lead to central banks scaling back their monetary-policy accommodation, despite several central bank officials, including Fed Chair Jerome Powell, noting that policy is likely to stay loose in the next few years. This means that yields may continue drifting higher for a while, something that may weigh further on equities, but we don’t expect this to last for long.
Eventually, investors may digest the idea that central banks will not begin normalization any time soon, which combined with the progress in the COVID-19 vaccination race, and the US fiscal stimulus package, may allow equities to rebound and trend north again. After all, we got a first taste of that during the EU and US sessions yesterday.
DAX: Technical Outlook
The technical picture of DAX on our 4-hour chart shows that, yesterday, the cash index drifted higher, but found resistance near the short-term downside line, drawn from the high of Feb. 16. After testing that line, the price moved sharply lower.
As long as the index continues to trade below that downside line, there is a chance to see some moves lower. However, given the slight indecisiveness between the buyers and the sellers, we will stay cautiously bearish for now.
If DAX pushes a bit higher again, but fails to break above the aforementioned downside line, another slide could be possible. The index may drift to the 13880 hurdle, marked by the inside swing high of Feb. 26, which also coincides with the 200 EMA on our 4-hour chart and might provide a bit of additional support. That said, if the bears are still holding on to that steering wheel, this could lead to a break of that hurdle, possibly opening the door for a move to the 13785 level, marked by the low of Feb. 24. and an intraday swing high of Feb. 26.
On the upside, if the previously-mentioned downside line breaks and the index climbs above one of its key resistance areas, between the 14052 and 14072 levels, marked by yesterday’s high and the high of Feb. 25, respectively, that may spook the bears from the field for a bit.
DAX could rise to the 14157 obstacle, a break of which may set the stage for the current all-time high, at 14190. If the buying doesn’t stop there, a further push north would place the price into the uncharted territory.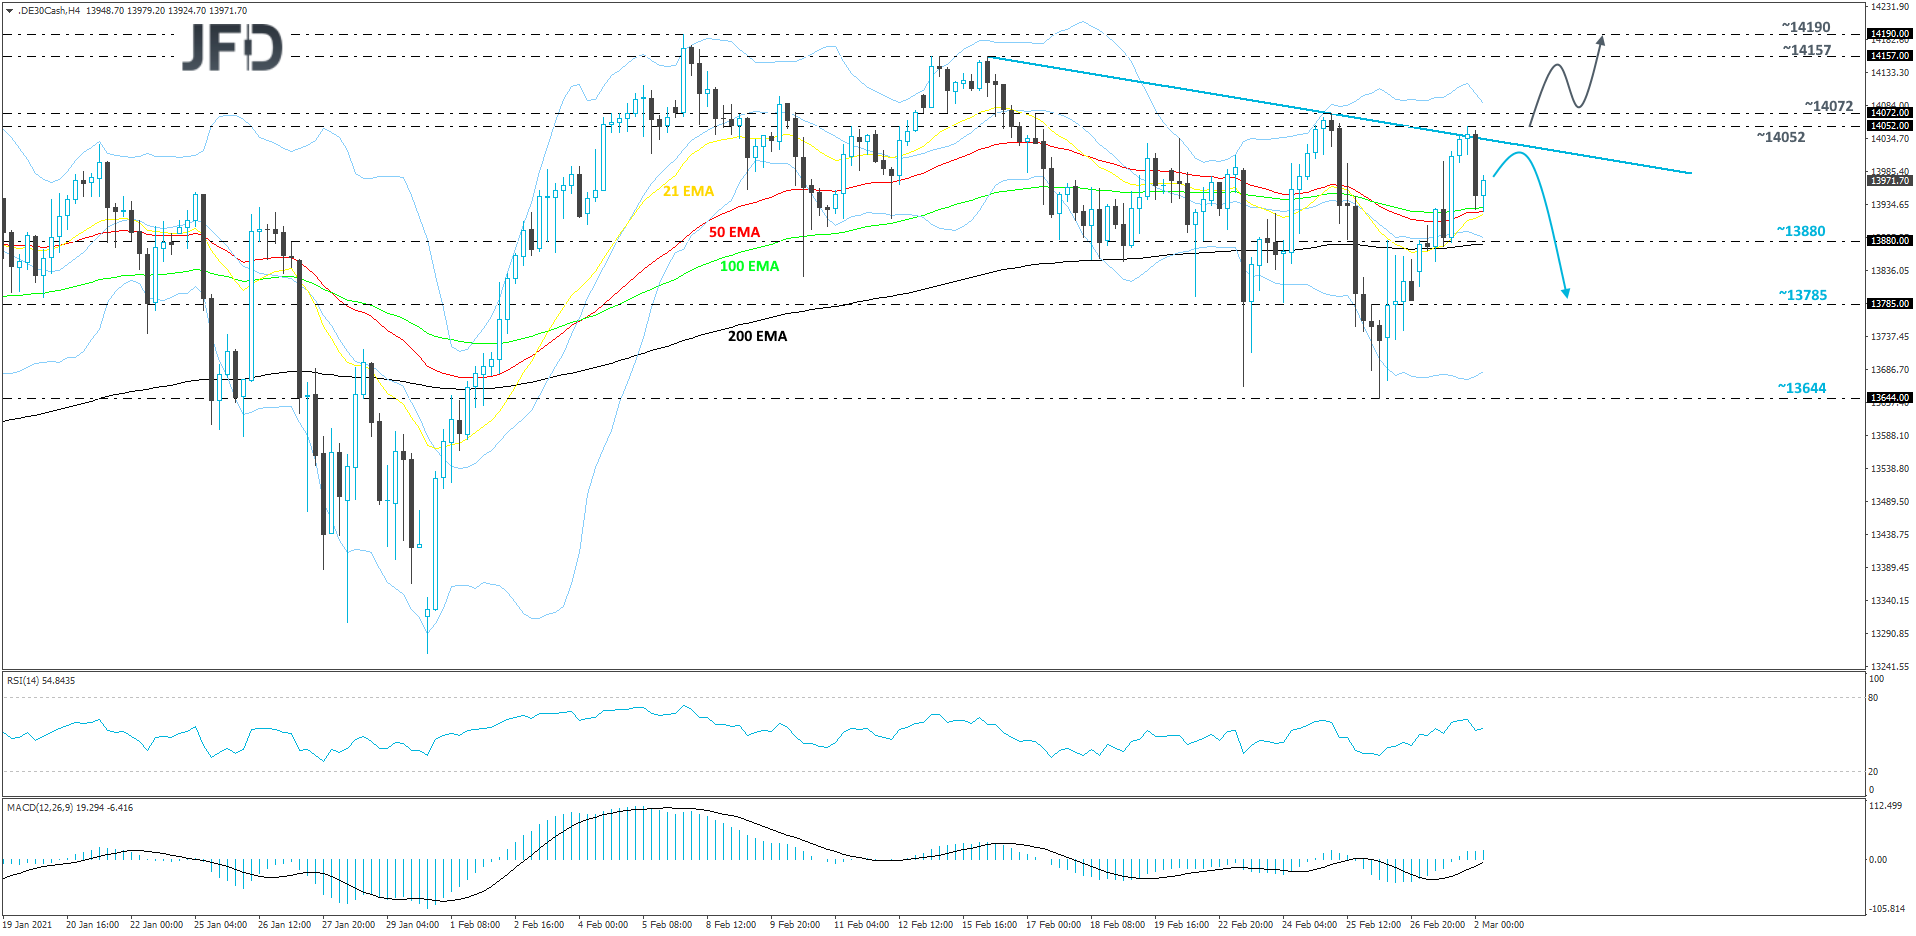
Eurozone's CPIs And Canada's GDP On Today's Agenda
As for today, the items on the economic agenda that may attract special interest are Eurozone’s CPIs for February, and Canada’s GDP for December and Q4 as a whole.
Kicking off with Eurozone’s numbers, the headline CPI rate is forecast to have ticked up to +1.0% yoy from +0.9% yoy, but the HICP excluding energy and food rate is anticipated to have declined to +1.1% yoy from +1.4% yoy. Despite the lockdown measures around the Eurozone, at the press conference following the latest ECB meeting, President Christine Lagarde said that the downside risks to the economic outlook are now “less pronounced”, making investors skeptical over further easing.
The minutes of that meeting revealed that other members shared Lagarde’s view, and thus, we don’t expect a slowdown in core inflation to spark speculation over more stimulus by the ECB, especially after the PMIs for February came in better than the January prints.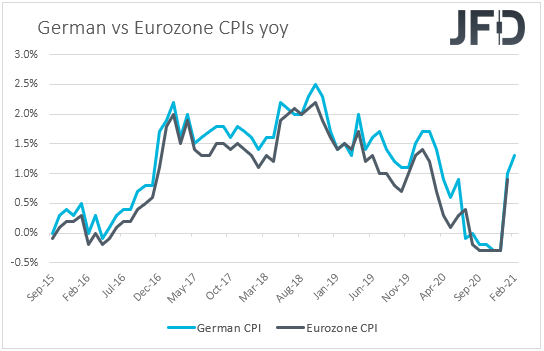
Now, passing the ball to Canada, December’s mom rate is expected to have declined to +0.3% from +0.7%, while no forecast is currently available for the qoq rate.
At its prior meeting, the BoC decided to keep interest rates and the pace of its QE purchases unchanged, disappointing those expecting a small cut or even a re-increase in QE. Officials also noted that “As the Governing Council gains confidence in the strength of the recovery, the pace of net purchases of Government of Canada bonds will be adjusted as required", which suggests that the next policy step for BoC may be tapering QE.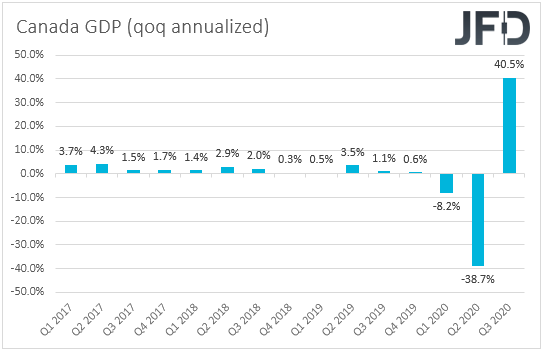
However, the employment report for January disappointed, with the unemployment rate rising to 9.4% from 8.9%, and the net change in employment showing that the economy has lost 212.8k jobs. What’s more, although the CPIs for January came in better than expected, they still stayed below the BoC’s inflation aim of 2%. Thus, with that in mind, we don’t believe that tapering may be in the cards in the months to come, especially if the GDP has slowed as the forecast suggests in December.
EUR/CAD: Technical Outlook
Yesterday, EUR/CAD took a dive and ended up moving closer to the 1.5210 zone, marked by the lowest point of February. At the same time, the pair is trading well below a short-term tentative downside line, drawn from the high of Jan. 28.
The rate may continue with its journey south, but in order to get comfortable with that idea, we would prefer to wait for a break below that 1.5210 area first. Hence our somewhat negative approach for now.
A drop below the 1.5210 zone would confirm a forthcoming lower low, possibly clearing the way to the 1.5151 hurdle, marked by the low of June 19. If that area provides initial support, the pair might rebound and climb back up a bit. However, if the rate is not able to push back above the 1.5210 zone, another drop may be possible. If this time EUR/CAD falls below the 1.5151 obstacle, the next potential target might be at 1.5092, which marks the lows of June 1, 3 and 8.
Alternatively, if the pair breaks the aforementioned downside line and then pushes through the 1.5385 barrier, marked by the highest point of February, that will confirm a forthcoming higher high, possibly sending the rate further north. EUR/CAD may travel to its next resistance area between the 1.5442 and 1.5455 levels, marked by the high of Feb. 12 and the low of Feb. 1. If the buying doesn’t stop there, the bulls might aim for a test of the 1.5514 hurdle, which is the high of Feb. 2.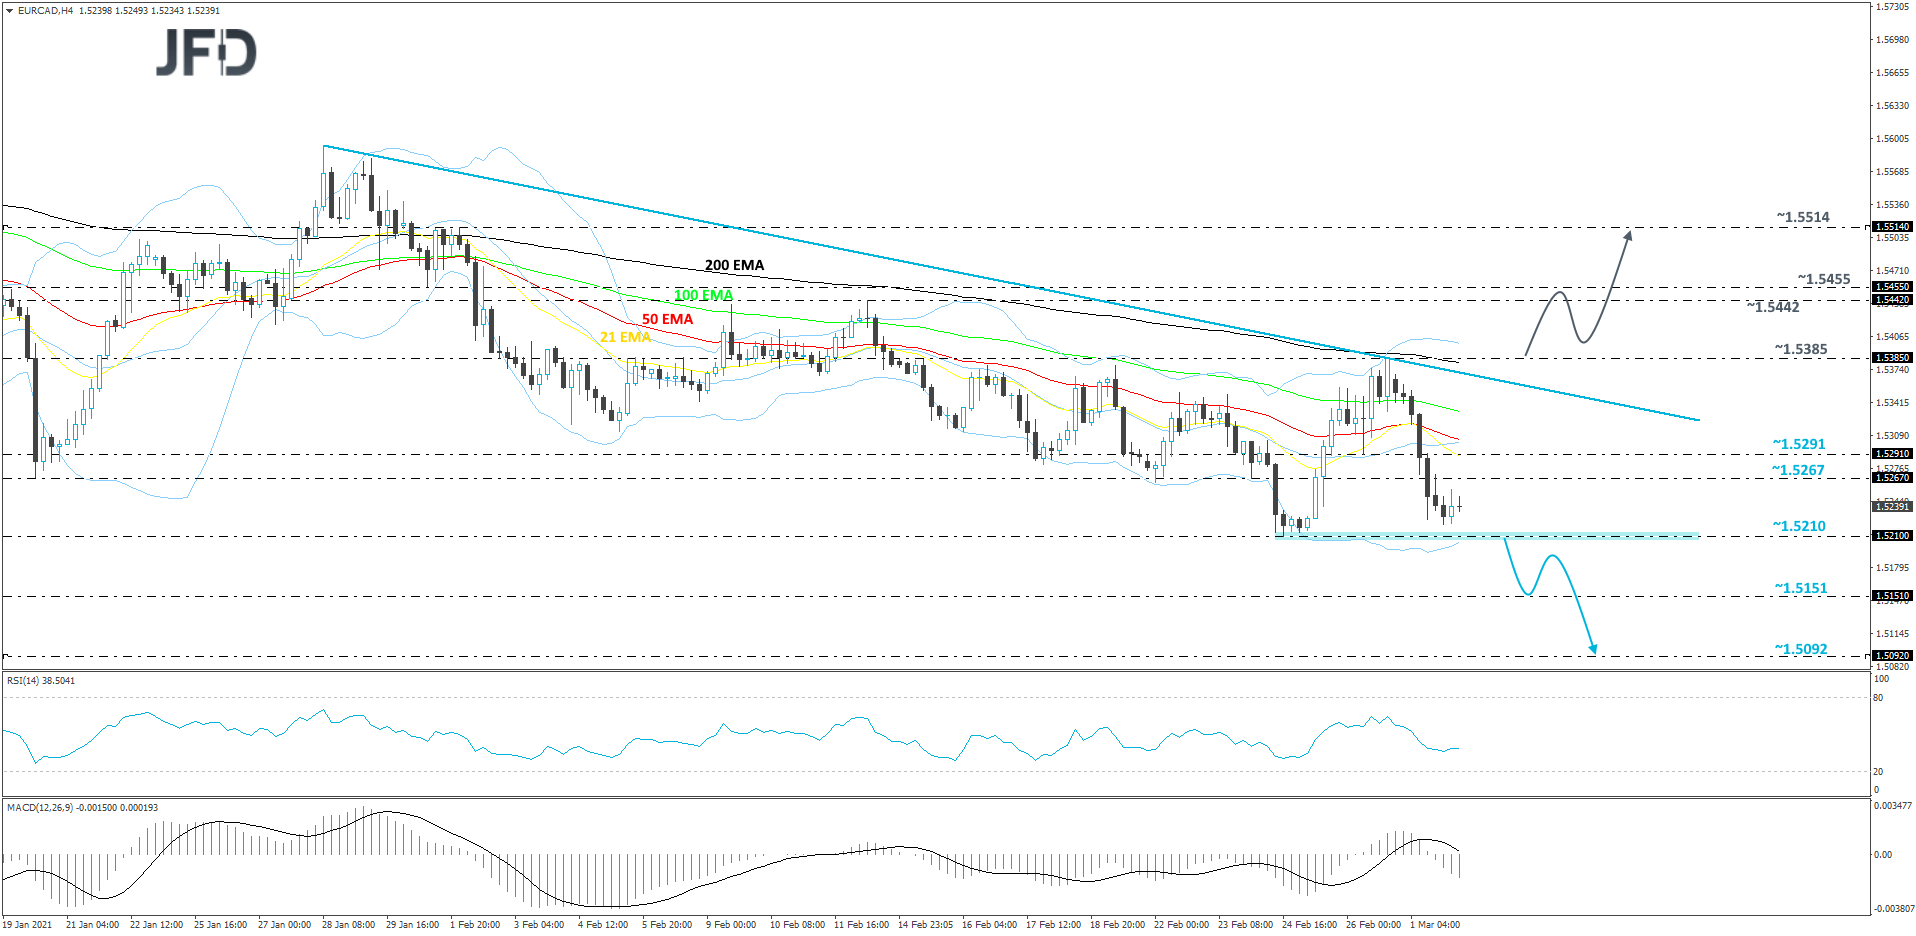
Rest of Today's Events
Apart from Eurozone’s inflation data and Canada’s GDP, we also get Germany’s unemployment rate for February, which is forecast to have held steady at 6.0%, as well as the API (American Petroleum Institute) report on crude oil inventories for last week, for which no forecast is available.
Tonight, during the Asian session Wednesday, Australia’s GDP for Q4 is due to be released. The qoq rate is expected to have declined to +2.5% from +3.3%, but the yoy one is anticipated to have increased to -1.8% from -3.8%.
China’s Caixin services PMI for February is also coming out, but no forecast is available.
We also have four speakers on the schedule: ECB Executive Board member Fabio Panetta, ECB Supervisory Board member Elizabeth McCaul, San Francisco Fed President Mary Daly, and Fed Board Governor Lael Brainard.
