Get 40% Off
🚨 Volatile Markets? Find Hidden Gems for Serious OutperformanceFind Stocks Now

Semiconductors Firm Up A Swing Low; Volatility Could Return

Published 09/17/2018, 12:34 AM

There wasn't a whole lot to Friday's action but two indices which were struggling a little did benefit.

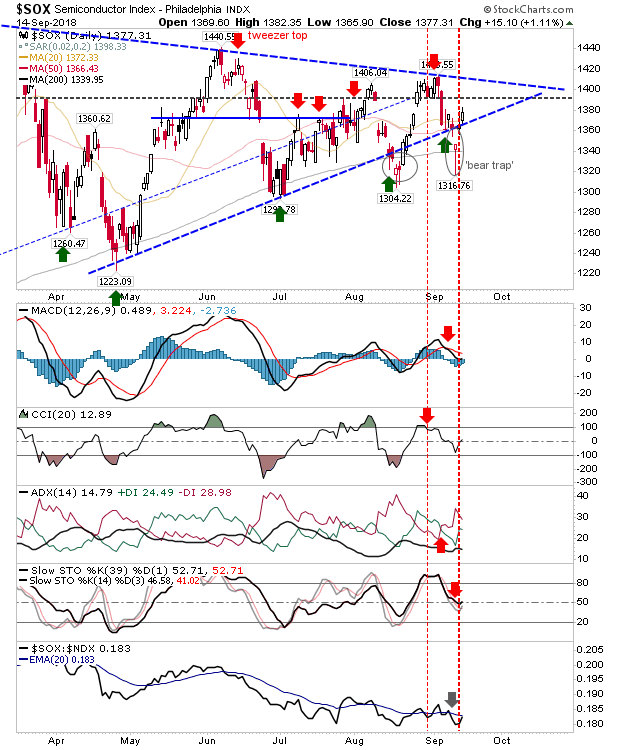
The Semiconductor Index gained 1% as it bounced strongly off the bullish 'morning star'. The consolidation triangle looks to be shifting to another pattern but resistance from triangle swing highs remains in effect and is the next challenge of the index. Technicals are net bearish and relative performance, while recovering, hasn't yet undone the most recent 'sell' trigger.
SOX Daily Chart


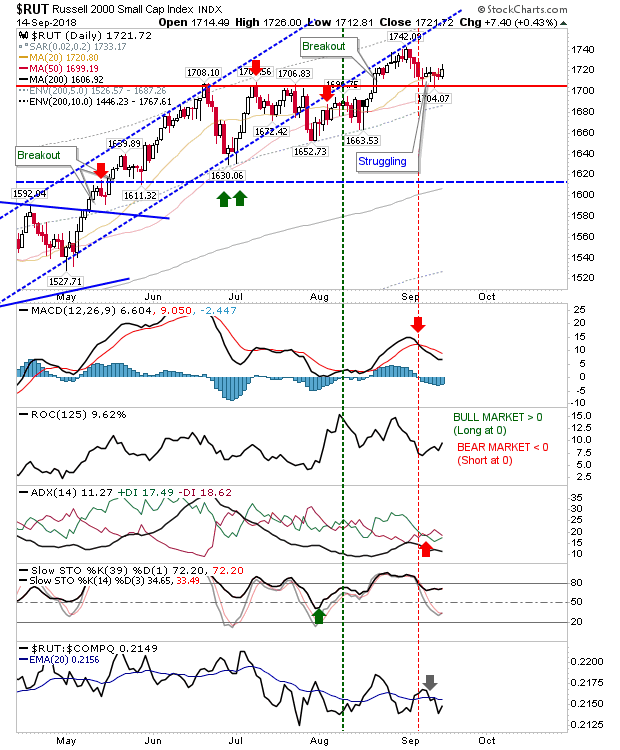
The Russell 2000 had a more low key day with a modest gain, enough to diffuse the series of weak doji days although the index is underperforming against the NASDAQ and technicals are mixed with bearish signals for the MACD and ADX.
RUT Daily Chart

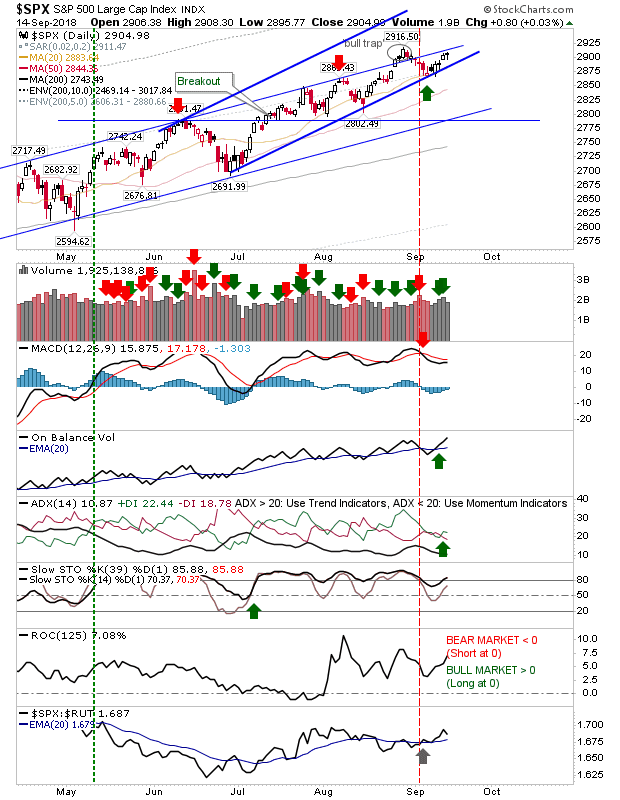
Other indices didn't have a whole lot to report for Friday. The S&P finished with a narrow range doji as relative performance remained positive despite a small loss.
SPX Daily Chart


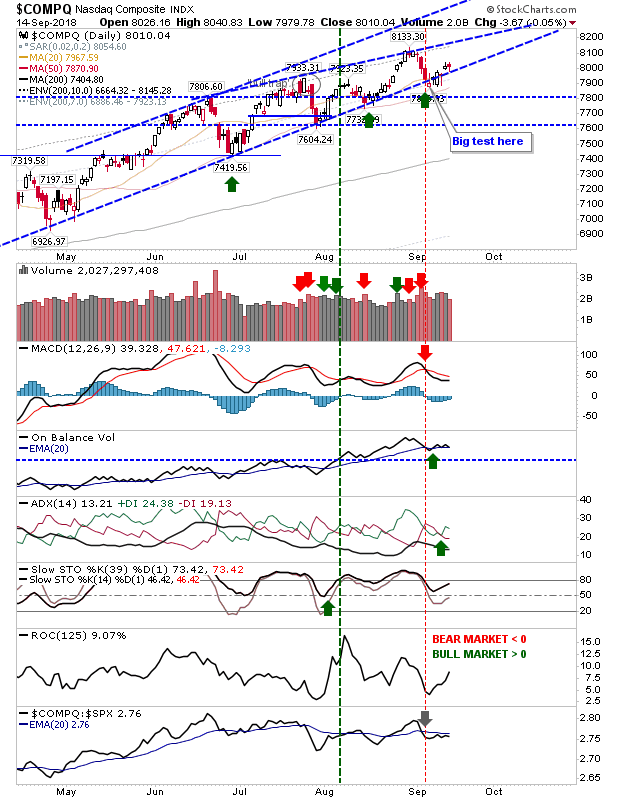
The NASDAQ also closed wih a doji on mixed technicals but as the index is a few days from challenging prior highs it's underperforming against the S&P. Let's see what Monday brings.
COMPQ Daily Chart

I haven't mentioned it in a long (long) time but volatility may be about to break out of its decade long underpeformance. How will markets react to this long needed period of chaos remains to be seen, but Trump will probably be a catalyst for this at some level.
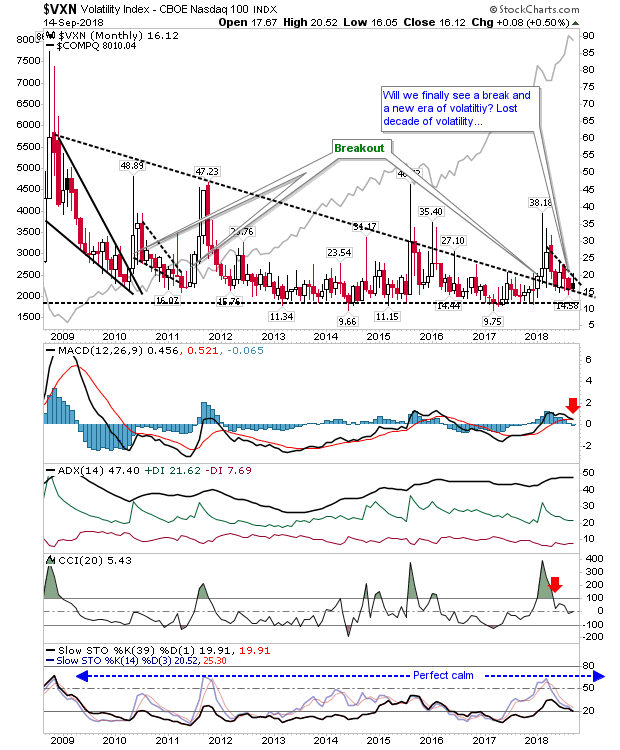
VXN Monthly Chart


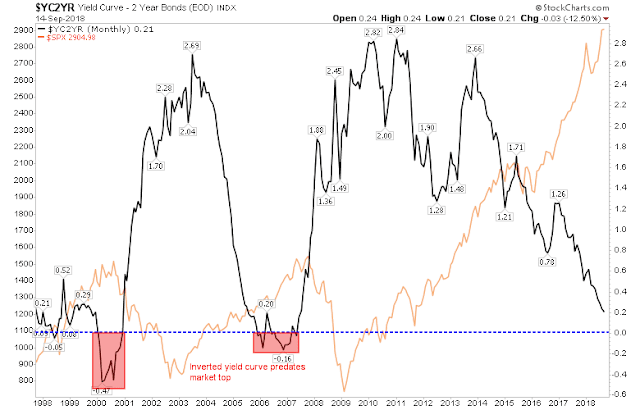
I'm not seeing much on the longer term charts—nothing to suggest bears are gaining control. The only one weakening at a rate which suggests the end will come within the next 12 month is the 2-year bond yield curve; an inverted yield curve has preceded the last two major sell offs. However, this is a slow burn chart and not something we can expect to see a change in the next couple of weeks or months.
3rd party Ad. Not an offer or recommendation by Investing.com. See disclosure here or remove ads .

YC2YR Monthly Chart


For today, keep track of the recovery in Semiconductors and Russell 2000. If the former can continue to advance to triangle resistance it will help push the NASDAQ and NASDAQ 100 to new all-time highs.

Latest comments

Risk Disclosure: Trading in financial instruments and/or cryptocurrencies involves high risks including the risk of losing some, or all, of your investment amount, and may not be suitable for all investors. Prices of cryptocurrencies are extremely volatile and may be affected by external factors such as financial, regulatory or political events. Trading on margin increases the financial risks.
Before deciding to trade in financial instrument or cryptocurrencies you should be fully informed of the risks and costs associated with trading the financial markets, carefully consider your investment objectives, level of experience, and risk appetite, and seek professional advice where needed.
Fusion Media would like to remind you that the data contained in this website is not necessarily real-time nor accurate. The data and prices on the website are not necessarily provided by any market or exchange, but may be provided by market makers, and so prices may not be accurate and may differ from the actual price at any given market, meaning prices are indicative and not appropriate for trading purposes. Fusion Media and any provider of the data contained in this website will not accept liability for any loss or damage as a result of your trading, or your reliance on the information contained within this website.
It is prohibited to use, store, reproduce, display, modify, transmit or distribute the data contained in this website without the explicit prior written permission of Fusion Media and/or the data provider. All intellectual property rights are reserved by the providers and/or the exchange providing the data contained in this website.
Fusion Media may be compensated by the advertisers that appear on the website, based on your interaction with the advertisements or advertisers.
© 2007-2024 - Fusion Media Limited. All Rights Reserved.