
Being a technical trader means we attempt to identify opportunities in a market, symbol or sector based on technical indicators, price patterns, advanced price theory/modelling, and much more. We don't particularly care if the opportunity is a bullish breakout rally or a bearish breakdown selloff, we simply want to find the “setups” that create this opportunity because that is our “sweet spot.” That is where the technical trader lives for the excitement of being able to find these technical setups and potentially trade them for profits/success.
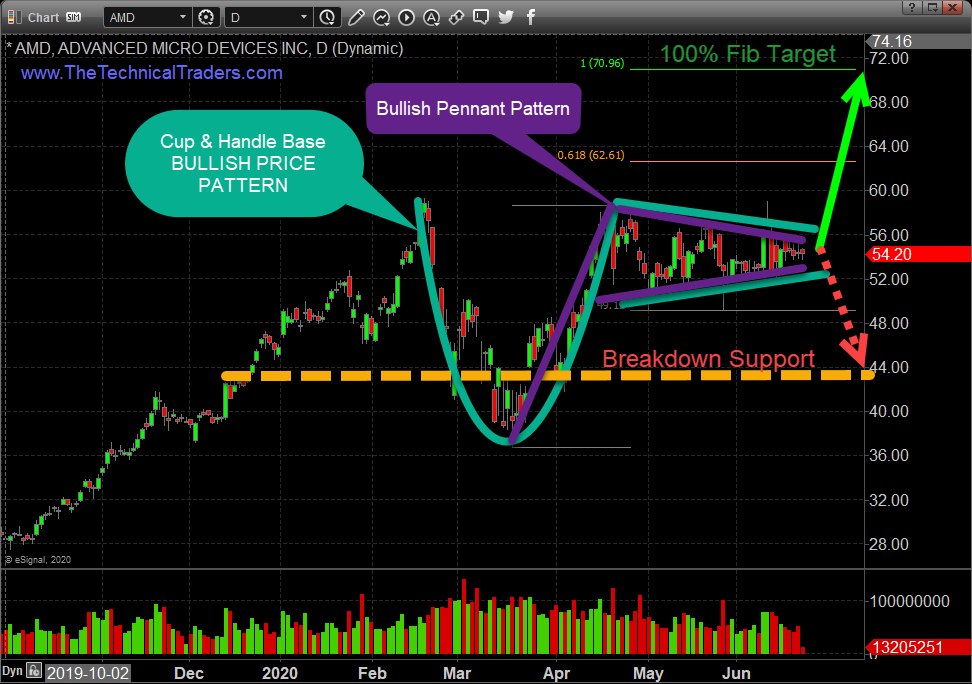
AMD Cup & Handle/Pennant Daily Chart
Let me teach you about two price patterns that are currently setting up in Advanced Micro Devices Inc (NASDAQ:AMD) where we can attempt to illustrate how a combination of technical triggers may align to present a very clear opportunity for technical traders.
This chart highlights a Cup & Handle pattern and a Bullish Pennant/Flag pattern. Ideally, the combination of these two patterns would suggest a higher probability of an upside bullish breakout rally beginning near the apex of the pennant formation. Yet, pennant formations, and other types of technical patterns, can often present a “washout sell-off in price” near the apex (or breakout area) as a means of shaking out stops before entering the next leg of the trend.
The “washout” move happens as price tightens into a narrowing price channel and nears the end of a Pennant/Flag formation pattern. This typically results in a broader price move against the predicted technical pattern trend, in this case, down. What happens is that traders tend to set stop levels just outside the tightening price channels as a means to protect against a price breakdown or rally against their position. These stop orders present very real volatility targets when price begins the apex breakout/breakdown event. The price will usually rotate against the primary technical trend for a short period of time, taking out many stops in the process, then stall and begin to move in the direction of the technical pattern predicted trend, which would be a rally towards $72.
In this case with AMD, the apex breakout move (to the upside) may be preceded by a price breakdown move near, or below, the $48 to $49 level – this is the “washout” move. We've highlighted what we believe is the lower technical support level in AMD near $44. This would represent a moderately deep
downside price “washout” target level for skilled technical traders. After this potential washout trend completes, a broader upside price trend usually sets us prompting a rally towards the original Pennant/Flag targets and likely completing the Cup & Handle pattern breakout.
The combination of the Cup & Handle pattern with the Bullish Pennant price pattern in AMD presents a very real opportunity for skilled technical traders. If your risk tolerance for the trade is capable of riding out the potential “washout low,” then you may consider setting your long entry trades just below the $48 to $50 levels as we near the true apex event of this trade setup. There is no guarantee that the washout event will move down to the lower $44 support level – so consider that level a deeper price support level representing a deeper downside price washout.
Ideally, the pending apex event of the Cup & Handle pattern and the Pennant pattern will result in a moderate 8% to 15% price washout move before the upside price trend initiates. This suggests that the washout rotation may end near $48 or $49, where price may find support, then begin to rally higher.
The Breakdown Support level on this chart should be considered a “failure level” for this bullish price pattern. If the price moves below that level when it initiates the apex volatility, then it is very likely that support has broken down and the predicted upside price trend has failed.
This is how technical traders approach many types of technical price triggers. We have an expected outcome for price and trends. We understand the volatility factors related to the trade triggers and we attempt to identify risk factors and profit capabilities before we execute any trades. If these parameters for our traders are adequate, then we may decide to execute the trade attempting to capture the profits.
Get ready, this AMD trade setup is nearing the apex moment and our research team believes a $48 to $50 entry price range is an adequate “washout” range with minor risk factors. Upside price targets should start near $61.50 and $69. If you understand how to execute the trade properly, we've just delivered a complete blueprint for a potential Apex Breakout trade in AMD using simple technical analysis.