Selling cash-secured puts can be used to accomplish several goals;
- Generate cash flow
- Buy a stock at a discount
- Used as part of a multi-tiered option selling strategy along with covered call writing (PCP strategy)
Our strategy goal along with overall market assessment, chart technicals and personal risk tolerance will ultimately guide us to the most appropriate put strikes price to select. When viewing an options chain for puts it is apparent that in-the-money strikes (higher than current market value) will generate the highest premiums.
This is because there is both an intrinsic value component and a time value component. At-the-money and out-of-the-money strikes only have time value components to the option premiums. Let’s evaluate both in-the-money and out-of-the-money strikes for Veeva Systems, Inc. (NYSE:VEEV), a stock on our Premium Watch List at the time I am penning this article (we are viewing 3-week returns).
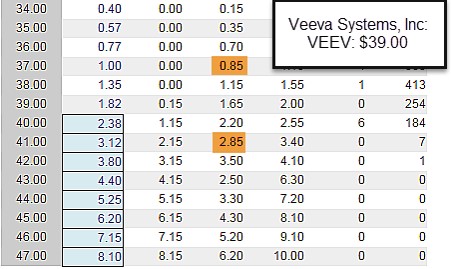
Put options chain for VEEV

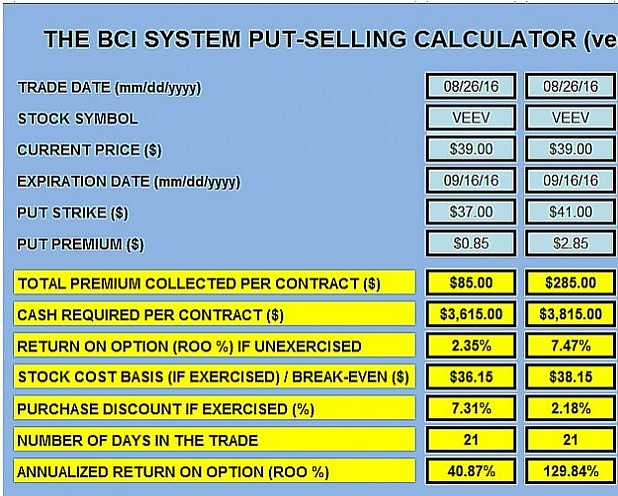
With VEEV trading at $39.00 per share, I have highlighted the $37.00 out-of-the-money put strike and the $41.00 in-the-money put strike. Both strikes are precisely $2.00 from the current market value price of $39.00. On first glance, we see the $41.00 strike offers more than triple the premium than does the $39.00 strike but the question is which strike is best for our goals?

First, notice that the time value components of both strikes are precisely the same. The out-of-the-money $37.00 put is all time value (0.85) and the in-the-money $41.00 put also has $0.85 of time value ($2.85 – $2.00). Given the equality of time value, the strike selection, to a great extent, will be based on our goals which must be identified prior to entering every trade.
Thought process leading to strike selection
Buying a stock at a discount
The in-the-money $41.00 strike will more likely be exercised (at a 2.18% discount). The $39.00 strike will only be exercised if share price drops below $39.00.
Using in conjunction with covered call writing
Since exercise is not an issue, both strikes are in play but since our goal is still cash generation, using the out-of-the-money strikes will give us sound returns and protection to the downside (7.31% in this case).
Using for cash flow only
Here we use the out-of-the-money puts. The more bullish we are, the closer to at-the-money we go. If we are strongly bullish I would favor out-of-the-money covered calls giving us the opportunity to generate two income streams in the same month with the same investment.
Discussion
The moneyness of put strikes is dictated by strategy goals, overall market assessment, chart technicals and personal risk tolerance. Selecting an in-the-money put strike to generate higher premiums is not a reason for strike selection because the loss of share value on the stock side will counterbalance the additional put premium.
Market tone
Global stocks continued moving higher on increasing evidence of improved US economic growth and rebounding inflation. Major US indices again rose to record highs during the week, oil prices dipped, with West Texas Intermediate crude at $53.50 a barrel versus $54.10 last week. Volatility, as measured by the Chicago Board Options Exchange Volatility Index (VIX), edged up to 11.37 from 10.9. This week’s reports and international news of importance:
- After a run of strong economic data from the United States, hopes intensified this week that the reflationary period underway since late 2016 would prove more durable than the four prior upturns during the current business cycle, which began in early 2009
- January retail sales rose a better-than-expected 0.4%, while December sales were revised up 1% versus a previously reported 0.6% advance.
- Firmer consumer prices at both the headline and core level, buoyant manufacturing output and upbeat regional Fed manufacturing surveys—particularly the Philadelphia Fed’s manufacturing index — which soared to a 33-year high — added to investor optimism
- After a series of strong economic reports, markets expect the US Federal Reserve to hike rates in the first half of 2017, perhaps as soon as next month’s meeting of the Fed’s rate-setting committee. Chair Janet Yellen said that it would be risky to wait too long to raise interest rates and that the committee would consider hiking rates in coming meetings
- Donald Trump’s pick for treasury secretary, Steven Mnuchin, was confirmed by the US Senate this week and sworn into office shortly thereafter. Tax reform is expected to be Mnuchin’s early focus with Trump unveiling his tax reform package in the next few weeks
- The International Monetary Fund and eurozone finance ministers remain at odds over the direction of the Greek bailout process. Without that relief, Greece’s debt is unsustainable
- With 75% of S&P 500 companies having reported (as of February 15th), aggregate earnings are up 5.2% year over year while revenues have grown 4.3%. According to Hedgeye Risk Management, if these trends hold up, the fourth quarter of 2016 will be the first time in two years that companies will have generated positive earnings for two straight quarters
THE WEEK AHEAD
MONDAY, February 20th
- Presidents’ Day holiday- None scheduled
TUESDAY, February 21st
- Markit manufacturing PMI, Feb.
WEDNESDAY, FEB. 22nd
THURSDAY, FEB. 23rd
- Weekly jobless claims
FRIDAY, FEB. 24th
- New home sales- Jan.
- Consumer sentiment index Feb.
For the week, the S&P 500 was up by 1.39% for a year-to-date return of 4.89%.
Summary
IBD: Market in confirmed uptrend
GMI: 6/6- Buy signal since market close of November 10, 2016
BCI: I am currently fully invested and have an equal number of in-the-money and out-of-the-money strikes. I remain defensive despite all the positive signs based on the lack of clarity regarding the policies of the new administration.
WHAT THE BROAD MARKET INDICATORS (S&P 500 AND VIX) ARE TELLING US
The 6-month charts point to a neutral to slightly bullish outlook. In the past six months, the S&P 500 was up 8% while the VIX (11.37) declined by 6%.
