Get 40% Off
🚨 Volatile Markets? Find Hidden Gems for Serious OutperformanceFind Stocks Now

Markets Tilt In Favour Of Bears But No Expansion On Selling Action

Published 08/14/2018, 01:47 AM
Updated 07/09/2023, 06:31 AM

Markets tilted in favour of bears although there was no expansion on the selling action from Friday.

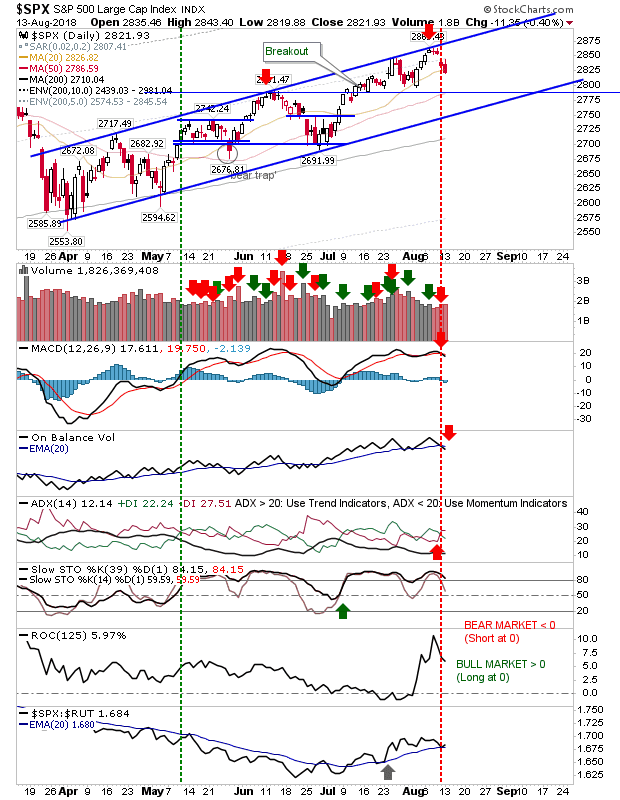
The S&P 500 undercut the 20-day MA but volume was down a little on Fridays. However, the selling did come with a fresh 'sell' trigger in On-Balance-Volume and relative performance against Small Caps is teetering towards a new 'sell' trigger.
SPX Daily Chart

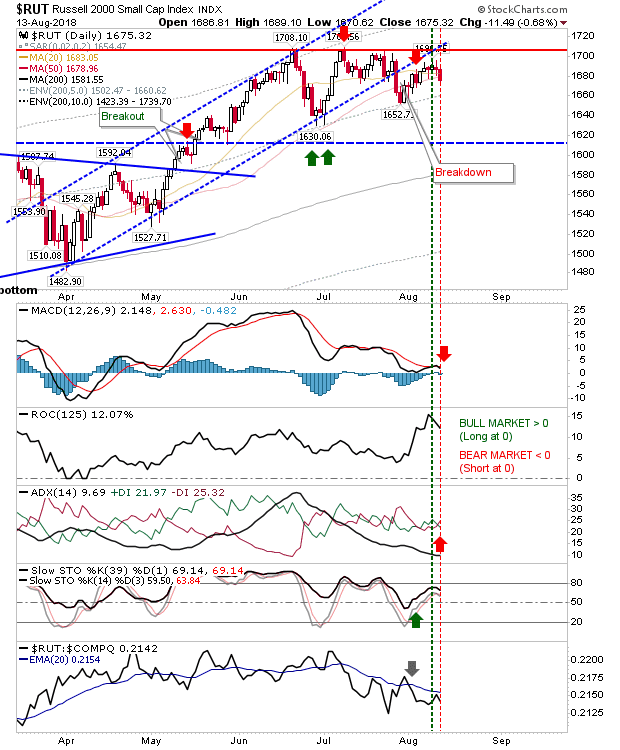
The Russell 2000 mounted a gentle rollover with a fresh 'sell' trigger in the MACD. There is a +DI/-DI trigger to go with the MACD trigger. Relative performance is still showing a Small Cap underperformance against Technology indices so further losses are still on the cards.
RUT Daily Chart


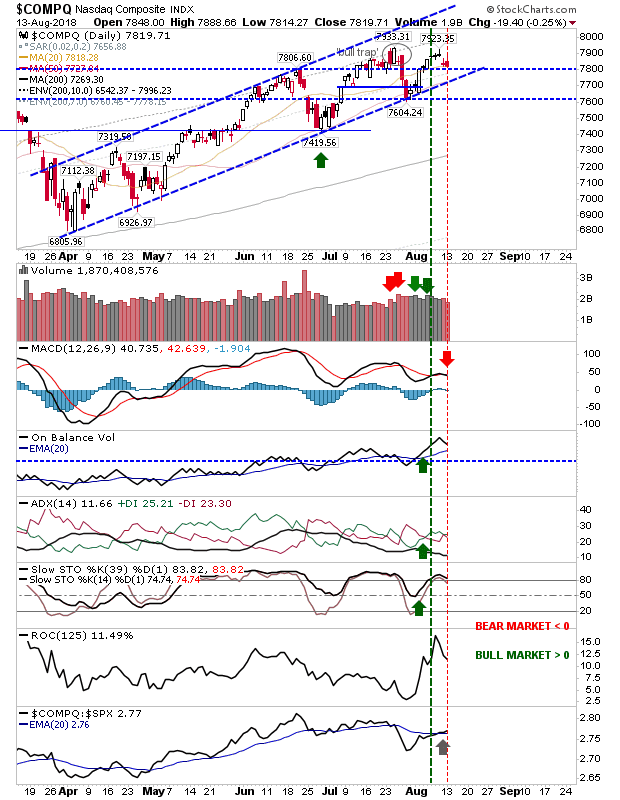
The Nasdaq didn't drop below 7,800 which keeps support intact and the challenge to reverse the 'bull trap' as still valid. Today's action keeps bulls in control despite the loss; buyers of 7,800 support will have welcomed the support hold. A drop below 7,800 is likely to trigger a cascade of stop selling, so value players may want to fish for fills in the 7.760 - 7,780 zone.
COMPQ Daily Chart


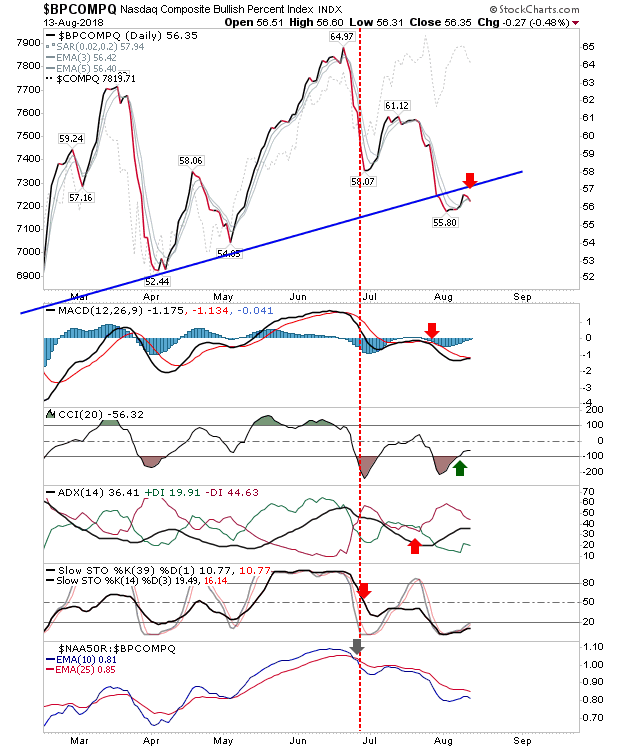
For Tech indices there is the worrying concern of an acceleration in the losses of the Bullish Percent Index; August saw a support break but if this drops below 50% then more stocks will be exhibiting more bearish than bullish action. This will have negative connotations for the Nasdaq and Nasdaq 100; significant market lows kick in when this metric reaches 30% or lower.
BPCOMPQ Daily Chart


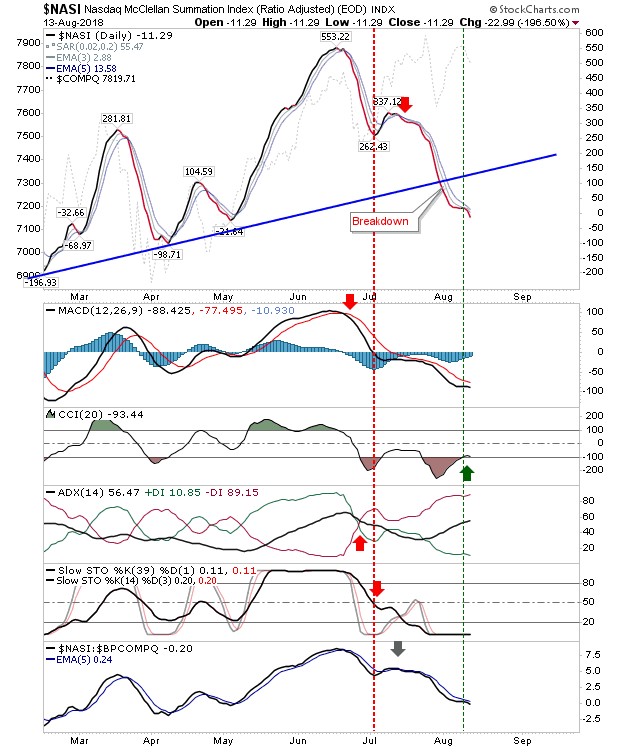
The Nasdaq Summation Index has been in a downward decline since the June peak. It too broke trendline support and it has yet to offer a swing low. Bear market lows occur at -800 or below but anything less than zero marks a tradable swing low.
3rd party Ad. Not an offer or recommendation by Investing.com. See disclosure here or remove ads .

NASI Daily Chart


The Philadelphia Semiconductor Index is (triangle) consolidation bound, but today's 'gravestone' doji suggests more selling is on the menu and a test of triangle support is on the cards.
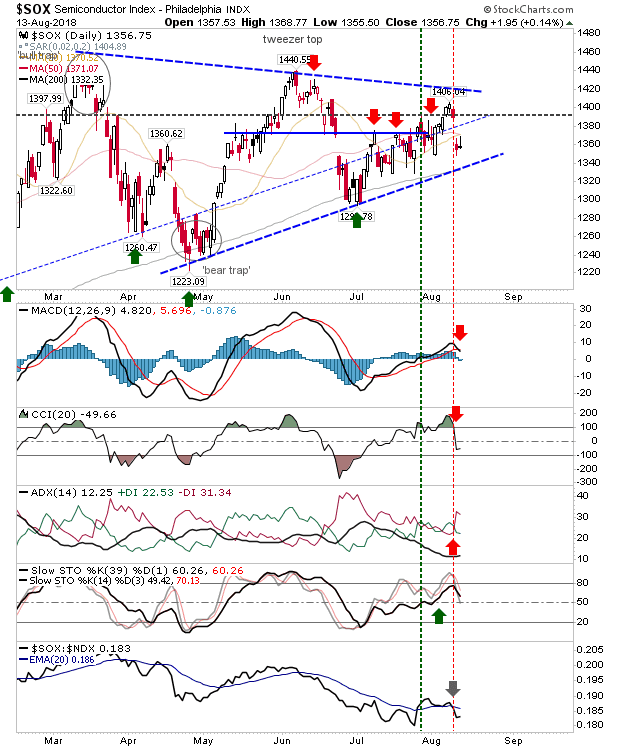
SOX Daily Chart


For tomorrow, look for further losses in the struggling Russell 2000. This may have a negative knock-on effect on the Nasdaq and Nasdaq 100, although despite some disappointing technicals the indices look better placed for buyers to take advantage. Large Caps are acting a little forgotten although favoring short-sellers at this time.

Latest comments

Risk Disclosure: Trading in financial instruments and/or cryptocurrencies involves high risks including the risk of losing some, or all, of your investment amount, and may not be suitable for all investors. Prices of cryptocurrencies are extremely volatile and may be affected by external factors such as financial, regulatory or political events. Trading on margin increases the financial risks.
Before deciding to trade in financial instrument or cryptocurrencies you should be fully informed of the risks and costs associated with trading the financial markets, carefully consider your investment objectives, level of experience, and risk appetite, and seek professional advice where needed.
Fusion Media would like to remind you that the data contained in this website is not necessarily real-time nor accurate. The data and prices on the website are not necessarily provided by any market or exchange, but may be provided by market makers, and so prices may not be accurate and may differ from the actual price at any given market, meaning prices are indicative and not appropriate for trading purposes. Fusion Media and any provider of the data contained in this website will not accept liability for any loss or damage as a result of your trading, or your reliance on the information contained within this website.
It is prohibited to use, store, reproduce, display, modify, transmit or distribute the data contained in this website without the explicit prior written permission of Fusion Media and/or the data provider. All intellectual property rights are reserved by the providers and/or the exchange providing the data contained in this website.
Fusion Media may be compensated by the advertisers that appear on the website, based on your interaction with the advertisements or advertisers.
© 2007-2024 - Fusion Media Limited. All Rights Reserved.