Get 40% Off
🚨 Volatile Markets? Find Hidden Gems for Serious OutperformanceFind Stocks Now

S&P 500: Sell In May And Go Away...For The Rest Of 2019?

Published 05/12/2019, 12:12 AM
Updated 07/09/2023, 06:31 AM

The following graph of the U.S. Major Indices shows the percentages gained from January 1 to the highs that were made, so far, in 2019 (about a week ago).

U.S. Major Indices YTD
In my 2019 Market Forecast post of December, I reported that the SPX gained 9.62% for 2018 and thought that, "2019 is likely to bring the same level of volatility and uncertainty, not just in U.S. equity markets, but in other world markets and world politics, as well." That was based on the assumption that central bankers would continue to tighten their monetary policies, with no further fiscal stimulus packages on the horizon in the U.S. at the time. Since then, the Fed has loosened its monetary policies and has indicated that no rate hikes would be implemented in 2019.

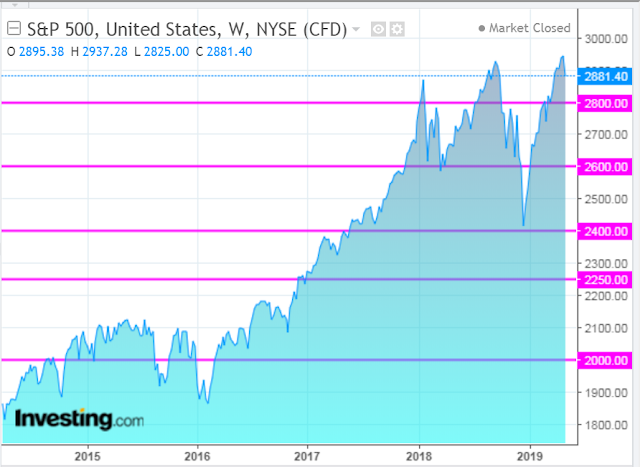
I further mentioned that the SPX may, either, retest its all-time high of 2940.91, or resume further declines, putting it at 2400, or lower, to possibly 2250 or 2000 (on the date of my post, the SPX had closed at 2546.2).

After hitting a low of 2346.58 on December 26, the SPX closed out the year at 2506.85 and has since climbed to a new high of 2954.13 on May 1, surpassing its prior high. It has pulled back a bit to close at 2881.40 on Friday.

After further examination, I'd now add 2800 and 2600 to those major support levels, which are evident on the following weekly chart (shown in simple "area" format). At a glance, 2600 stands out as a "right shoulder" target on a potential "inverted head and shoulders" formation, albeit following a large rally from the 2016 Presidential election, rather than after a decline, which would be more typical for this type of technical formation in order for it to trigger and spawn a new rally to, potentially, new highs.
3rd party Ad. Not an offer or recommendation by Investing.com. See disclosure here or remove ads .

SPX Weekly 2014-2019

Chart powered by TradingView

Inasmuch as the SPX has pretty much fulfilled my forecast in its gains for 2019, we may have just seen the top put in for the year, and we may see it pull back to, at least, 2600, or lower. At the risk of repeating myself, I'll, instead, refer to my recent posts here, here, here and here, which describe the market gauges I'm monitoring in this regard.

Latest comments

thanks for your insightful article, im thinking it will retest its 200 moving day average again, which will be around $2400, who knows, but im looking to buy the dip in this area, if not, might see the $2000-$2250 level you are talking about.
Risk Disclosure: Trading in financial instruments and/or cryptocurrencies involves high risks including the risk of losing some, or all, of your investment amount, and may not be suitable for all investors. Prices of cryptocurrencies are extremely volatile and may be affected by external factors such as financial, regulatory or political events. Trading on margin increases the financial risks.
Before deciding to trade in financial instrument or cryptocurrencies you should be fully informed of the risks and costs associated with trading the financial markets, carefully consider your investment objectives, level of experience, and risk appetite, and seek professional advice where needed.
Fusion Media would like to remind you that the data contained in this website is not necessarily real-time nor accurate. The data and prices on the website are not necessarily provided by any market or exchange, but may be provided by market makers, and so prices may not be accurate and may differ from the actual price at any given market, meaning prices are indicative and not appropriate for trading purposes. Fusion Media and any provider of the data contained in this website will not accept liability for any loss or damage as a result of your trading, or your reliance on the information contained within this website.
It is prohibited to use, store, reproduce, display, modify, transmit or distribute the data contained in this website without the explicit prior written permission of Fusion Media and/or the data provider. All intellectual property rights are reserved by the providers and/or the exchange providing the data contained in this website.
Fusion Media may be compensated by the advertisers that appear on the website, based on your interaction with the advertisements or advertisers.
© 2007-2024 - Fusion Media Limited. All Rights Reserved.