Get 40% Off
⚠ Earnings Alert! Which stocks are poised to surge?
See the stocks on our ProPicks radar. These strategies gained 19.7% year-to-date.
Unlock full list

See The Trends Of The U.S. Economy, Looking Towards 2020

Published 02/04/2018, 04:19 AM
Updated 07/09/2023, 06:31 AM

Summary: The course of US politics might depend on what happens to the US economy during the past three years. Predictions are difficult, but the trend is clear: the economy is slowing.

By most metrics, economic growth peaked in January 2015. Here are graphs showing the past five years, all in terms of percent year-over-year growth. These show the trend, washing out the noise — but does not show the most recent changes.

Job growth

Growth in nonfarm payrolls peaked in January 2015 at 2.3%. In January 2017 it was 1.4%.
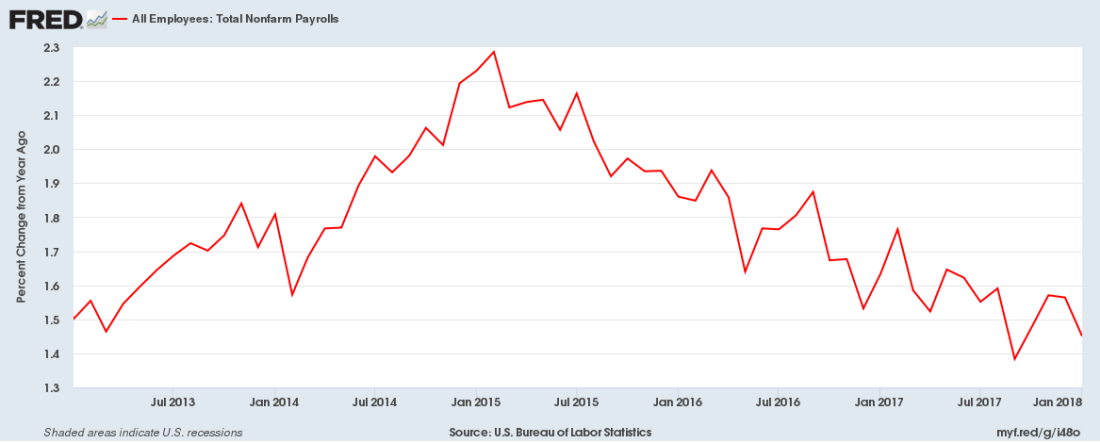
Total Nonfarm Payrolls

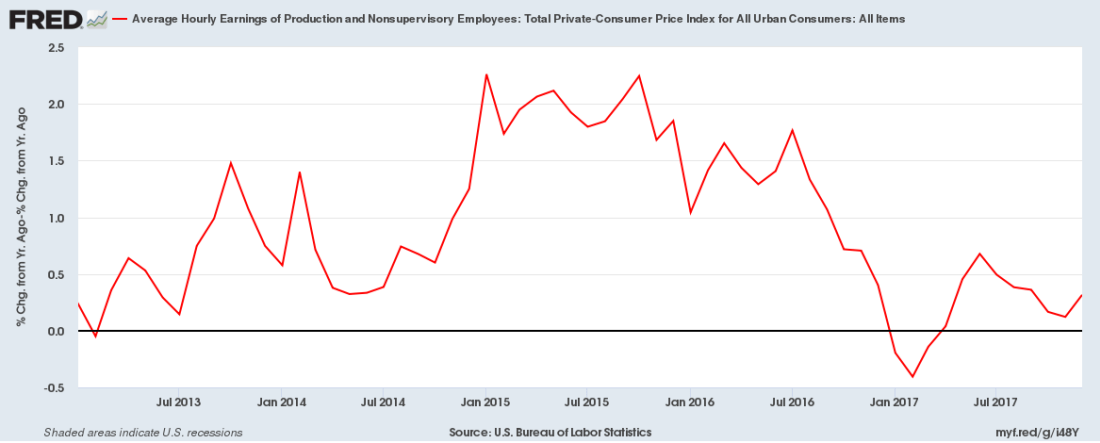
Workers’ real wages

Growth of workers’ wages per hour — wages of production and non-supervisory workers (85% of all workers) minus the CPI — peaked in January 2015 at 2.3%. In December (the last month available) it was 0.3%. It was probably roughly the same in January (hourly wages were unchanged).

Avg Hourly Earnings

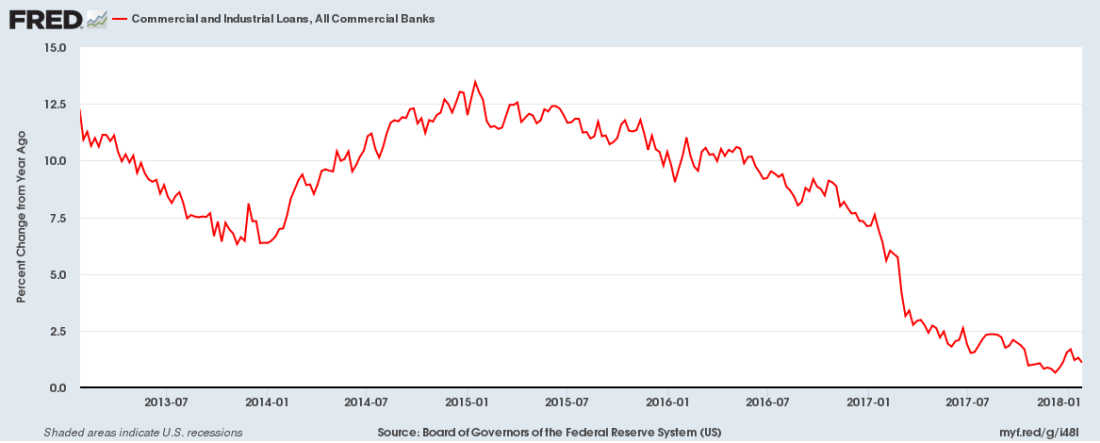
Commercial and Industrial Loans

Growth in Commercial and Industrial Loans by banks peaked in January 2015 at 13.5%. It was +1.1% in January. The largest drop was from January 11, 2018 to March 8.

Commercial and Industrial Loans

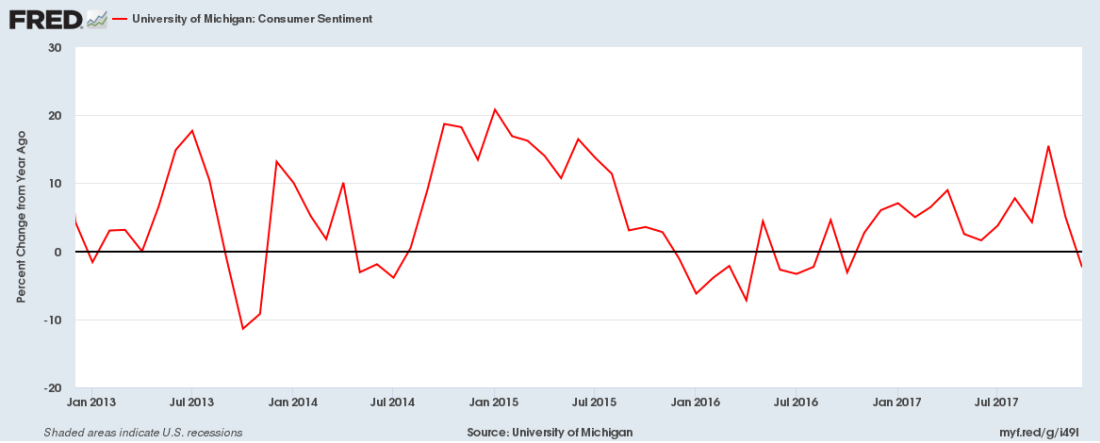
University of Michigan Consumer Sentiment Index

Improvement in this measure of consumer sentiment peaked in January 2015 at +20%. In January it was 2%. It is a leading indicator.

University of Michigan Consumer Sentiment Index

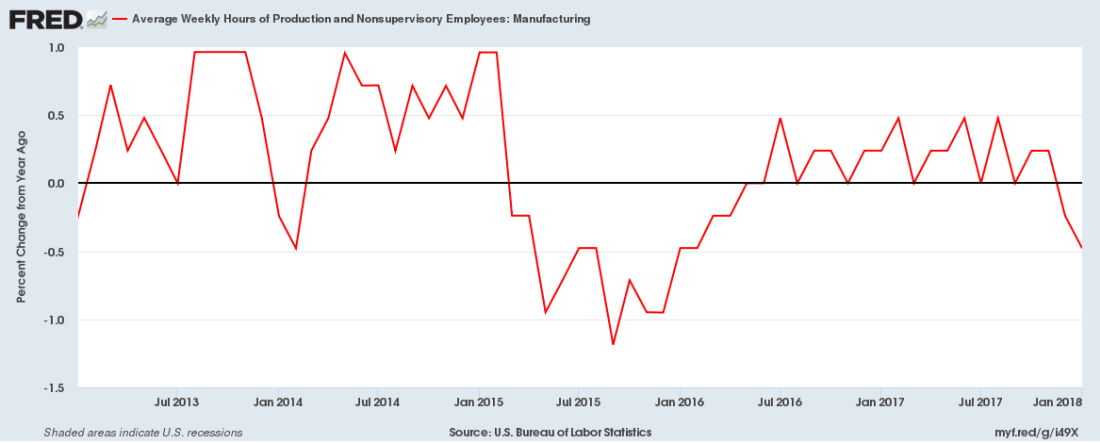
Average weekly hours

Growth in average weekly hours of production and non-supervisory workers peaked in January – February 2015 at 1%. In January it was 0.5%.

Average weekly hours

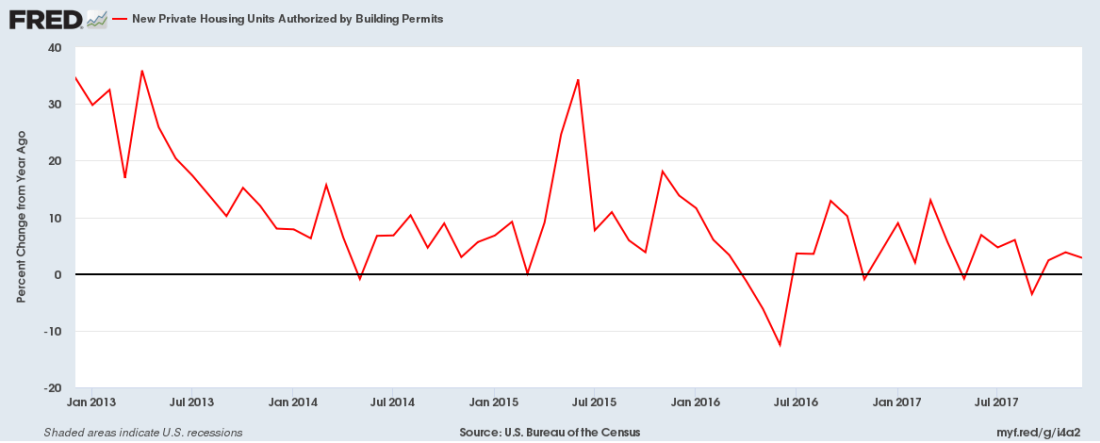
Building permits

Growth in new permits for private housing units peaked in June 2015. This is a leading indicator.

Building permits

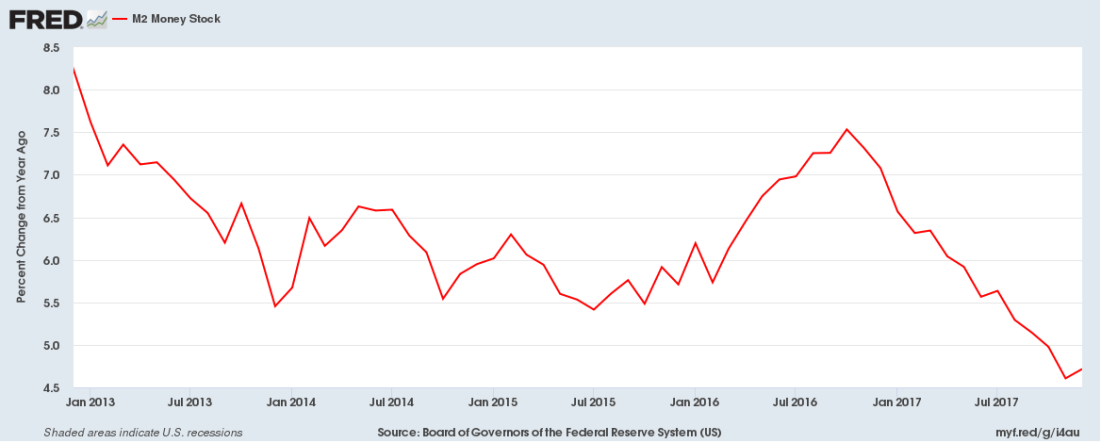
The supply of money

M2 consists of M1 (cash and checking account) plus savings accounts, money market accounts, and small-denomination time deposits (less than $100,000).

M2 Money Stock

The OECD Leading Indicators look strong!

The OECD Composite Leading Indicator (CLI) for the US peaked in July – August 2014 at 101.0. It was 99.9 in November 2018. The CLI for the full OECD has followed the same path. Note: unlike the other graphs, this shows the absolute value of the CLI (not the YoY change).

OECD Chart: Composite leading indicator (CLI), Amplitude adjusted, Long-term average = 100, Monthly, Jan 2010 – Nov 2017

Some leading indicators continue to rise

The big story: Durable goods.

Growth in new orders for durable goods are accelerating, after lagging throughout the expansion.
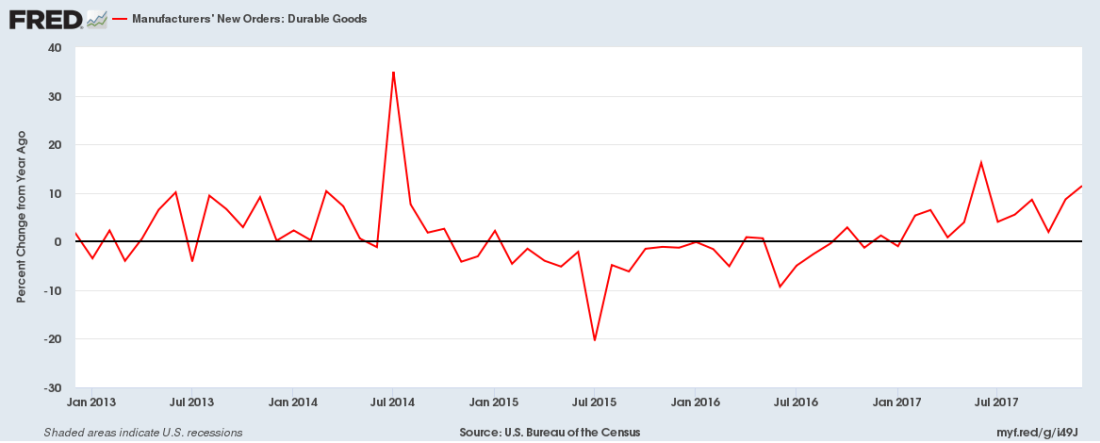
Durable Goods

Latest comments

Risk Disclosure: Trading in financial instruments and/or cryptocurrencies involves high risks including the risk of losing some, or all, of your investment amount, and may not be suitable for all investors. Prices of cryptocurrencies are extremely volatile and may be affected by external factors such as financial, regulatory or political events. Trading on margin increases the financial risks.
Before deciding to trade in financial instrument or cryptocurrencies you should be fully informed of the risks and costs associated with trading the financial markets, carefully consider your investment objectives, level of experience, and risk appetite, and seek professional advice where needed.
Fusion Media would like to remind you that the data contained in this website is not necessarily real-time nor accurate. The data and prices on the website are not necessarily provided by any market or exchange, but may be provided by market makers, and so prices may not be accurate and may differ from the actual price at any given market, meaning prices are indicative and not appropriate for trading purposes. Fusion Media and any provider of the data contained in this website will not accept liability for any loss or damage as a result of your trading, or your reliance on the information contained within this website.
It is prohibited to use, store, reproduce, display, modify, transmit or distribute the data contained in this website without the explicit prior written permission of Fusion Media and/or the data provider. All intellectual property rights are reserved by the providers and/or the exchange providing the data contained in this website.
Fusion Media may be compensated by the advertisers that appear on the website, based on your interaction with the advertisements or advertisers.
© 2007-2024 - Fusion Media Limited. All Rights Reserved.