Sector rotation is flashing a big red warning signal that the post-Brexit bounce could be over as soon as next week. Before I show you the S&P 500 with a Sector Rotation Model overlay, let's briefly review the concept of sector rotation.
Sector rotation can be helpful in determining what the S&P 500 is likely going to do next.
For sector rotation analysis we will use six sectors: three bearish sectors and three bullish sectors.
The three bearish sectors we will use are Consumer Staples, Healthcare, and Utilities. People can't do without consumer staple products. Examples of consumer staple items are food, water, shelter, toothpaste, and toilet paper. The healthcare sector is defensive because its goods and services are essential. The utility industry is an example of a defensive sector because people will always need gas and electricity.
The three bullish sectors we will use are Consumer Discretionary, Financial, and Technology. Consumer discretionary items are things that people can do without if they don't have the income. Consumer discretionary items include apparel, entertainment and leisure, and automobiles. When incomes are on the rise, people save more, and that helps the Financial sector. When consumer spending goes up, businesses often have to borrow money from the bank to keep up with demand. Life insurance, funeral insurance, and retirement savings are financial products in high demand when consumers have more money. Technology is considered to be a bullish sector because spending on smartphones, video games, TVs, and other electronic gadgets go up when consumers have more disposable income.
The Sector Rotation Model (SRM) relies on calculations applied to the three bullish and three bearish sectors discussed above. When Staples, Healthcare, and Utilities are outperforming, the market is weaker, which creates negative values on the SRM. Conversely, when Financial, Technology, and Discretionary sectors are outperforming, the SRM will show sustained positive values, and an uptrend in the market usually occurs.
The SRM allows us to look below the market's surface and gauge underlying psychological sentiment.
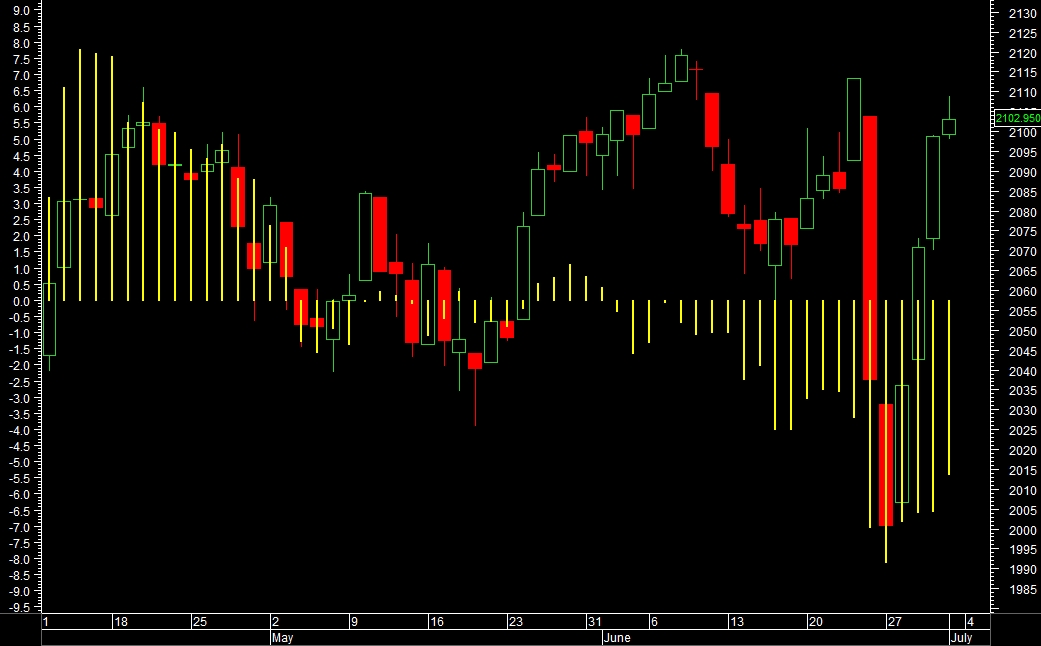
S&P 500 with Sector Rotation Model chart overlay
The SRM (yellow bars) can be interpreted much like traditional oscillators. Market tops are signalled by a sustained positive SRM followed by a quick drop below zero. Market bottoms are signaled by a sustained low SRM followed by a quick rise above zero.
Until the SRM rises back above the zero line, the current rally on the S&P 500 should be met with skepticism. Keep tight stops in place, and when you have a 5% to 10% profit in a stock you are long. Take it and move it to the sidelines and the safety of cash.

