Summary
While most sectors were positive this week, the performance was decidedly defensive.
Over the last month, defensive sectors have led the pack.
I look at the healthcare and consumer staples charts in more detail.
Let's begin - as we always do - with the weekly performance table:

There's good and bad news here. The good news is that most sectors rose. In fact, only one sector (energy) was down and its loss was marginal. But the bad news is that the strongest sectors were defensive. healthcare rose the most, followed by utilities. The XLP (consumer staples) was the fourth strongest sector.
We see a similar pattern in the 1-month performance numbers:

In that time frame, the top three sectors are all defensive: utilities, staples, and healthcare.
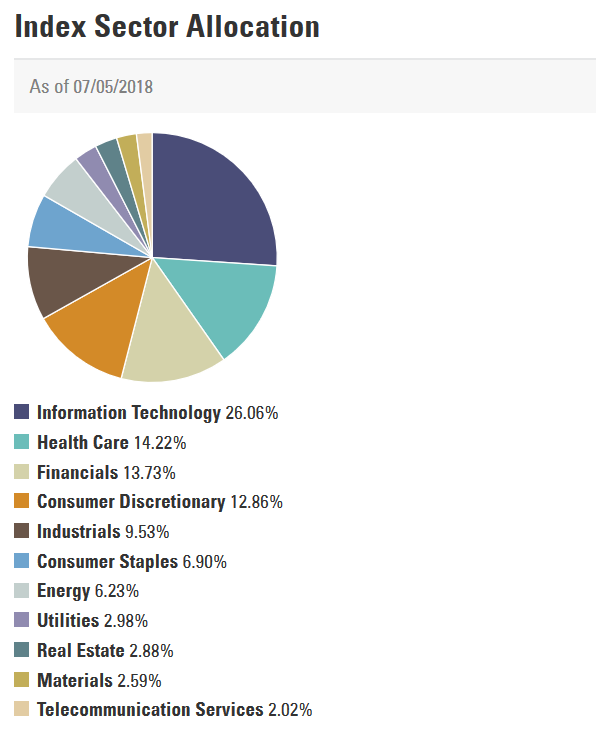
What does this mean? First off, it means traders and investors are concerned enough about something to move their assets into a more conservative investment. It also means there's less upward pressure on the index. Here's a pie chart showing the sector composition of the SPY:

The defensive sectors comprise 24% of the SPY) index. And when we take out healthcare, that percentage drops to about 10%. In order for the market to keep moving higher, 10-25% of the market must outperform the remaining 75%. That's a very difficult proposition.
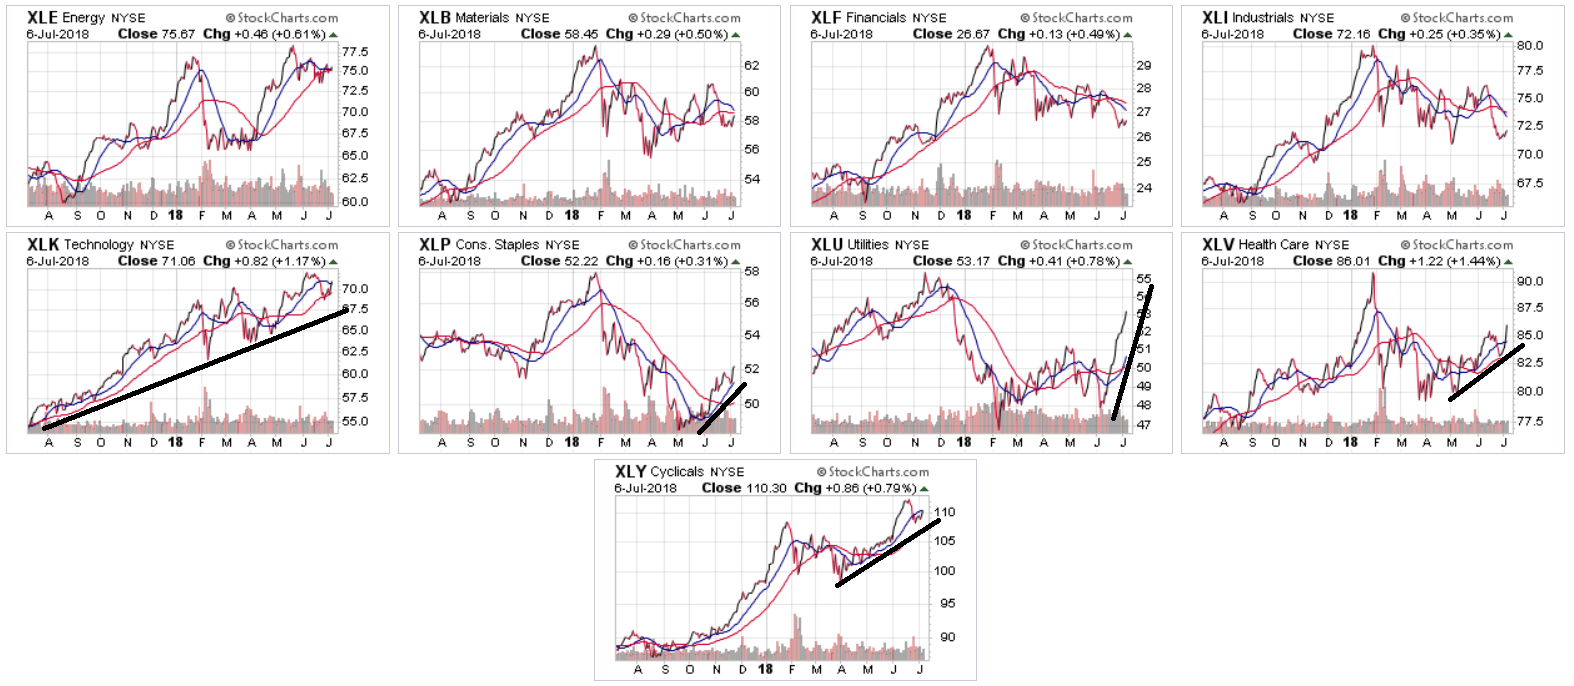
We're also seeing some modest bearishness in the year-long charts of the major sector ETFs:

Tech (second row; far left) is still in a solid uptrend. Consumer discretionary is still rising (bottom chart). But the other three sectors that are rising are defensive - the XLP, XLU, and XLV. All the top charts are weak. And there's little reason to think they'll start to rally, save for energy. Basic materials and industrials are directly in the trade war line of fire. The financial sector has to deal with rising interest rates, which lowers the interest rate spread from the yield curve, which will lower profits. Only energy has the potential to rally.
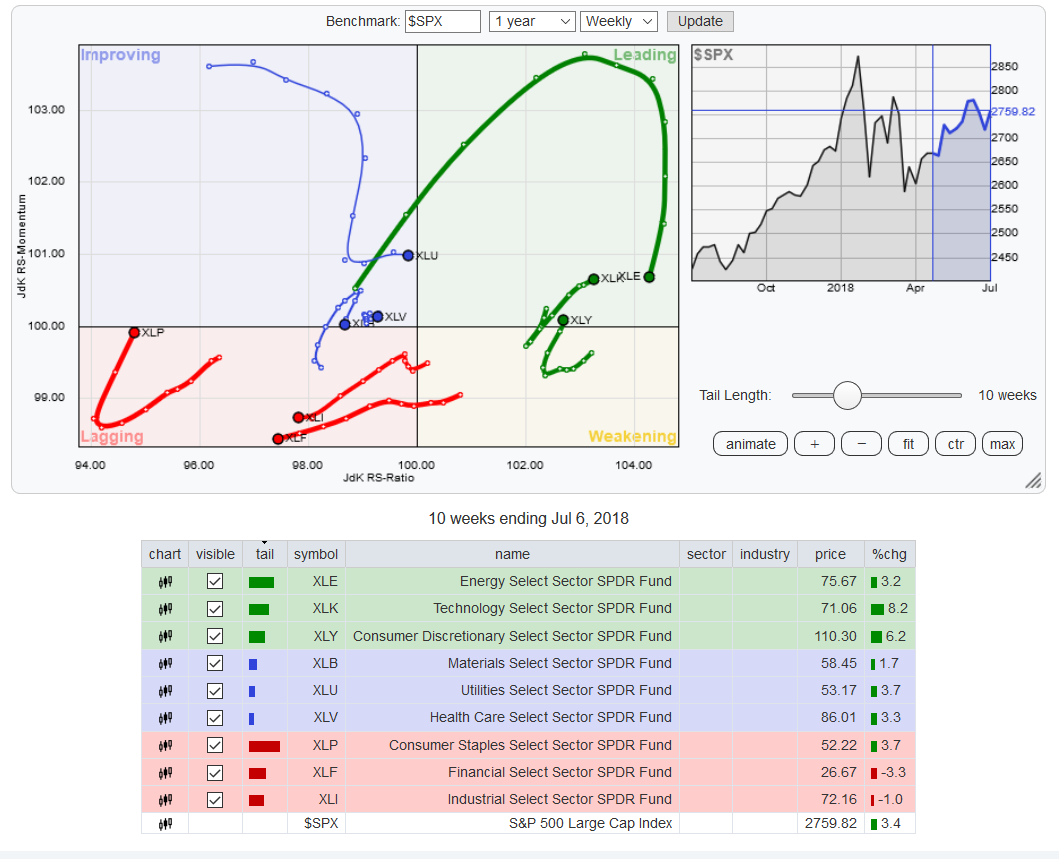
Next, let's take a look at the sectors' relative performance:

On a 12-week basis, energy, tech, and consumer discretionary are still outperforming the SPYs. Two of these industries (tech and discretionary) are considered "aggressive." But in the "moving up" category, we again see a distinctly conservative bent, which takes us back to our first observation - that there's a conservative trend developing.
Finally, let's look at a few chart groups, starting with the 10 largest holdings of the XLKs:

There are still some very strong uptrends above. Apple (NASDAQ:AAPL) (top row, far left), Microsoft (NASDAQ:MSFT) (bottom row, second from left), and Visa (NYSE:V) (bottom row, second from right) are all in solid, 1-year uptrends. Intel (NASDAQ:INTC) (bottom row, far left) recently broke its trend, thanks to the trade war rhetoric. Facebook (NASDAQ:FB) and both Google (NASDAQ:GOOGL) charts (top row, right three charts) are both in short-term uptrends. Verizon (NYSE:VZ) (bottom row, far right) has had a quick pop. And Cisco (NASDAQ:CSCO) (top row, second from left) is moving sideways. Only AT&T (NYSE:T) (bottom row, middle) is showing any weakness.
The combined reading of all these charts is for a continued uptrend in the XLKs. As this sector is 26% of the SPYs, the market's recent uptrend still has some support.
But let's now turn to the defensive sectors that are gaining ground, starting with the XLVs:

There are a number of shorter-term charts that are increasing. Merck (NYSE:MRK) (bottom row, middle), Pfizer (NYSE:PFE) (bottom row, second from right), Bristol-Myers Squibb (NYSE:BMY) (top row, second from right) and Gilead (NASDAQ:GILD) (top row, far right) have all seen recent uptrends. Johnson & Johnson (NYSE:JNJ) (bottom row, far left) has seen a nice pop in the last few weeks. And, most importantly, there are no extremely bearish charts.
And finally, here are the 10 largest holdings for the XLPs:

The tobacco companies Altria (NYSE:MO) (top row, far right) and Philip Morris (NYSE:PM) (bottom row, second from right)) are near 52-week lows, but the high dividend of these stocks is attracting a bid. Next, notice a large number of short-term uptrends. CVS Health Corp (NYSE:CVS), Coca-Cola (NYSE:KO), Colgate (NYSE:CL), PepsiCo (NASDAQ:PEP), and Procter & Gamble (NYSE:PG) have all recently caught a bid. Most of these stocks were recently at/near 52-week lows, which means they have plenty of upside room.
So where does this leave us? While there's support for the recent rally in the broader indexes, it's diminishing. And the continued rise of defensive sectors tells us traders and investors are positioning for the end of the cycle.
Disclosure: I/we have no positions in any stocks mentioned, and no plans to initiate any positions within the next 72 hours.
I wrote this article myself, and it expresses my own opinions. I am not receiving compensation for it (other than from Seeking Alpha). I have no business relationship with any company whose stock is mentioned in this article.
