Summary- Once again, the markets are taking a more conservative/end of the cycle, performance orientation.
- Utilities and consumer staples are this week's leaders.
- I explain the "all seasons" concept.
Over the last six months, sector growth has taken a standard, end-of-an expansion turn, with utilities, healthcare, and consumer staples leading the pack. Last week, that changed a bit, as tech and energy were two of the better-performing sectors. But this week, things have once again turned more conservative:
This week, utilities were the top-performing sector, rising about 1%. Consumer staples (another conservative group) were the second best performing, also advancing about 1%. Industrials rounded out the pack, up .6%. Just as telling are the sectors that fell. Tech was the worst performer, dropping 2.7%. The energy sector was also off, as was consumer discretionary.
The one-month performance was also conservative: healthcare and utilities were the number one and three performing sectors, rising 3% and 1%, respectively. Energy has fallen sharply, down 4.3%.
Finally, the three-month performance chart shows a very conservative orientation, with utilities, healthcare, and consumer staples occupying the one, two, and three spots respectively. Once again, energy is the worst performer.
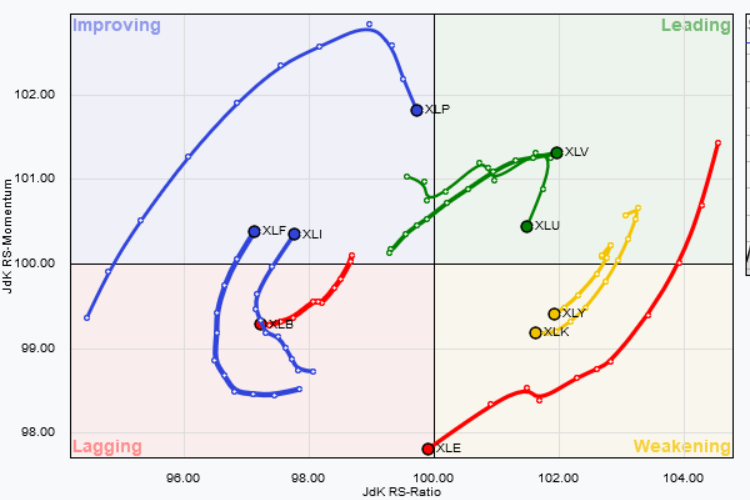
The relative strength graph really shows the overall situation very clearly:
Let's take this clockwise from the upper right-hand corner. Healthcare (XLV) is leading the SPYs over the last 10 weeks. It's still progressing to the NE corner, meaning it is still moving higher relative to the SPYs. Utilities (XLU) are also leading, but they've taken a turn to the south and are heading for the "weakening" section of the chart. Consumer discretionary (XLY) and technology (XLK) are now weakening relative to the SPYs (they're both yellow). Energy (XLE) has fallen out of bed; it's red and is clearly in the lagging section of the diagram, as is the basic materials (XLB) sector. As for those sectors that are improving, we have the financials (XLF), industrials (XLI) and consumer staples (XLP). The latter is by far the better-performing sector.
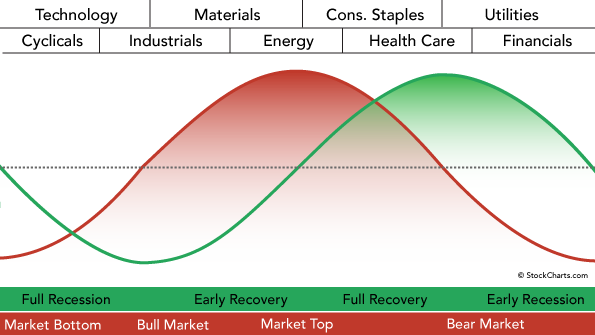
So, what's going on here, really? To answer that question, we need the following diagram which is from Martin Pring:

This is derived from his book, The All Seasons Investor, which should be in every investor's library. As the economy moves through trough, recovery, peak, and recession, so do the market sectors. Let's take this from trough:
1.) We buy industrials and basic materials at the beginning of an expansion. Why? Because this is when they're lowest from a technical perspective. It's also right before their profits will start to rise. Industrial operations will start to pick up as the expansion starts. Basic materials companies will also see their profits increase because they supply the raw materials to industrial companies.
2.) As the economy continues to expand, energy demand rises, which means we should start to invest in energy companies. It's also now that consumers start to increase their purchasing, which means we should also start adding consumer cyclical companies to our portfolio (I don't know why it's not there in the picture; it certainly should be).
3.) At the end of the cycle, we start to add consumer staples, utilities, and healthcare. Why? Because these companies supply goods and services that are needed during all economic seasons. And since the economy is starting to slow, we should move our assets to more conservative areas of the economy.
4.) Finally, we buy financials at the tail-end of the expansion or right as the economy is entering a recession. Why? It has to do with interest rate policy. As the economy moves into a recession, the Federal Reserve is lowering interest rates to stimulate growth. This increases banks' net interest margin (the difference between income from loans and income paid on deposits), which increases their profits.
And as we're buying new sectors, we should be taking profits from our other positions.
And that, ladies and gentlemen, should explain what I mean by "late cycle market."
Disclosure:I/we have no positions in any stocks mentioned, and no plans to initiate any positions within the next 72 hours.
I wrote this article myself, and it expresses my own opinions. I am not receiving compensation for it (other than from Seeking Alpha). I have no business relationship with any company whose stock is mentioned in this article.


