Summary
For the week, utilities and consumer discretionary topped the list of performers.
Since the first of the year, consumer discretionary is the top performer.
I take a closer look at the consumer discretionary and healthcare sectors.
Let's start with a performance table:

Utilities were the best-performing sector, followed by consumer discretionary and staples. Energy fell in sympathy with a weakening oil market while financials fell as the Fed raised rates.
Let's turn to the YTD numbers:

Consumer discretionary tops the list, followed by tech. Utilities and staples are at the bottom. This is a decidedly bullish dataset: two sectors you'd expect to do well in an expansion are rallying while two sectors that are more defensive in nature are at the bottom.
Let's next turn to the relative strength of the sectors:
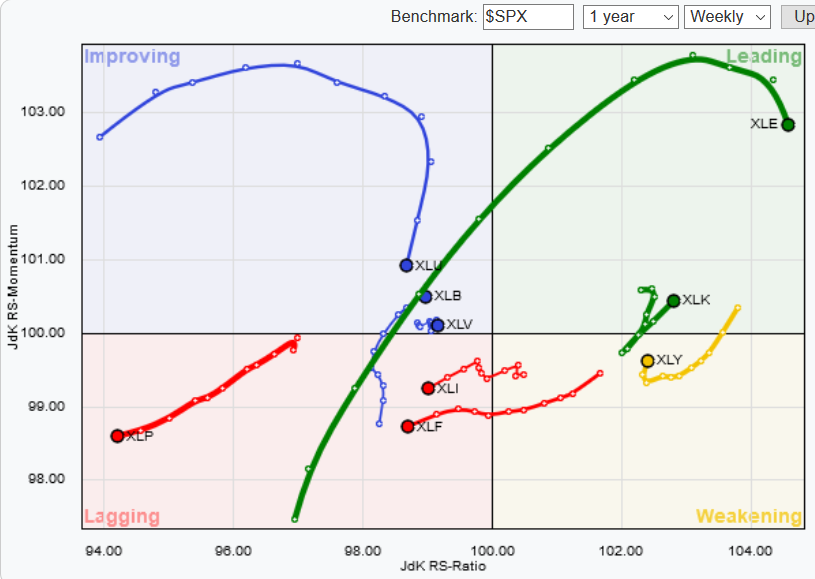
There's good and bad news on this chart. The good news is that the energy sector is strong, as is tech. There's also a pretty big weakness. Sectors whose performance is improving relative to the SPYs ideally move counter-clockwise through the chart - moving from lagging to improving to leading to weakening. But right now, only the basic material sector (which makes up less than 3% of the index) is taking that course. The healthcare sector is also improving, but it's only 14% of the SPDR S&P 500 (NYSE:SPY). Put another way, no sector that is improving relative to the SPYs is large enough to push the entire market higher. Tech and discretionary are about 40% of the SPYs, so they'll help to keep the index afloat for now. But the SPYs need new leadership, which we're not seeing.
Let's now turn to some of the sectors, starting with consumer discretionary.
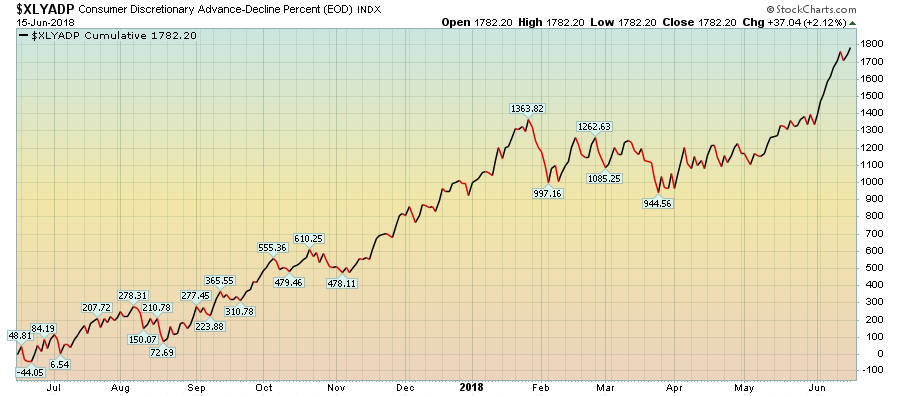
The chart above shows the advance-decline percent index for the XLYs, which is currently rising. This simply means there is more positive volume than negative in the XLYs.
Next, let's look at the Consumer Discretionary Select Sector SPDR (NYSE:XLY) chart:
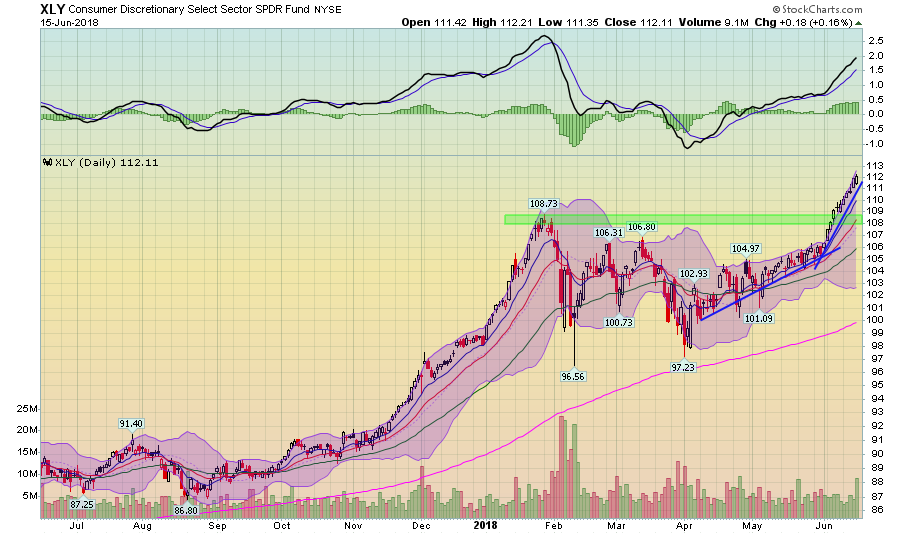
This is a very bullish chart. Prices are rising and they're using the EMAs for technical support. In turn, the EMAs are all moving higher and the shorter ones are above the longer ones. The long-term trend (the 200-day EMA) is also moving higher. Finally, momentum is rising. And there is plenty of room for the MACD to run. This is about as bullish as it gets.
Let's delve a little deeper into the index, looking at its ten largest members:
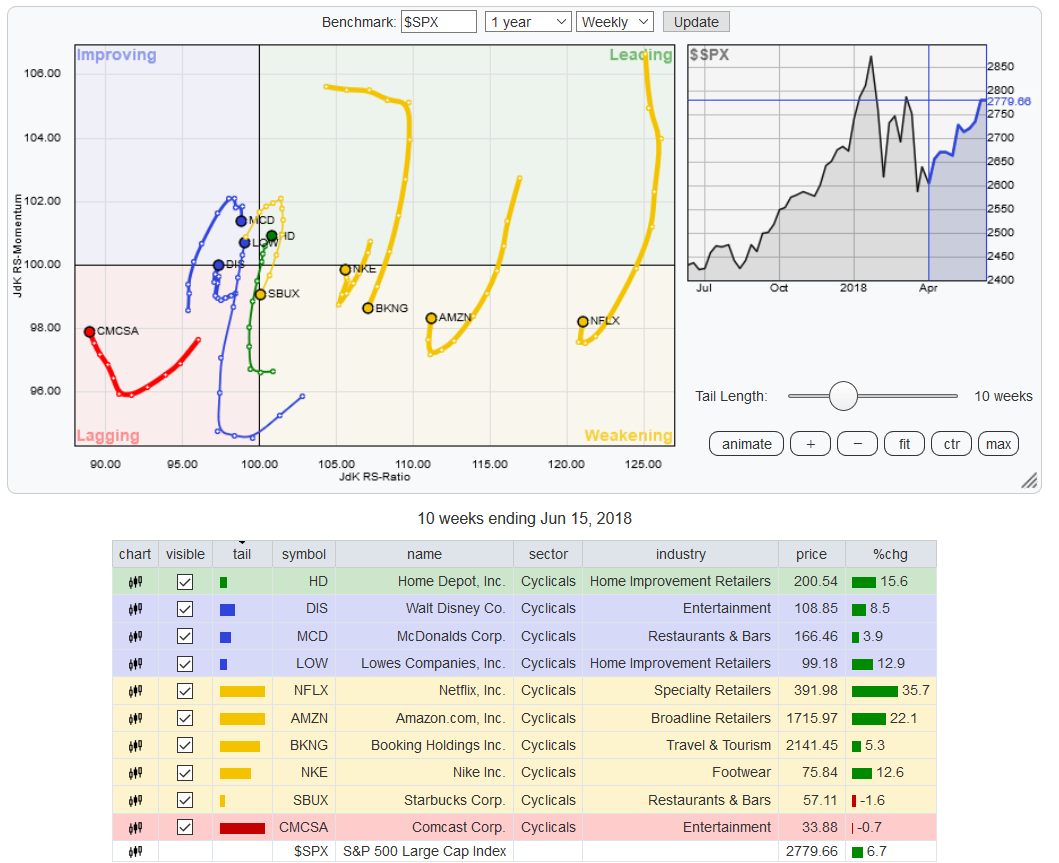
Let's reverse engineer the numbers. Comcast (NASDAQ:CMCSA)is dropping because investors view the AT&T (NYSE:T)/Time Warner Inc DRC (SA:TWXB34)) as negative for CMCSA. Home Depot (NYSE:HD) and Lowe’s Companies Inc (NYSE:LOW) are advancing in tandem with a stronger labor and housing market. Walt Disney Company (NYSE:DIS) is up thanks to its rival bid for Twenty-First Century Fox Inc A (NASDAQ:FOXA)) (to compete with the T/TWX deal), while McDonald's (NYSE:MCD) is up on its cost-cutting initiative announced last week.
Here are the one-year charts for these stocks:
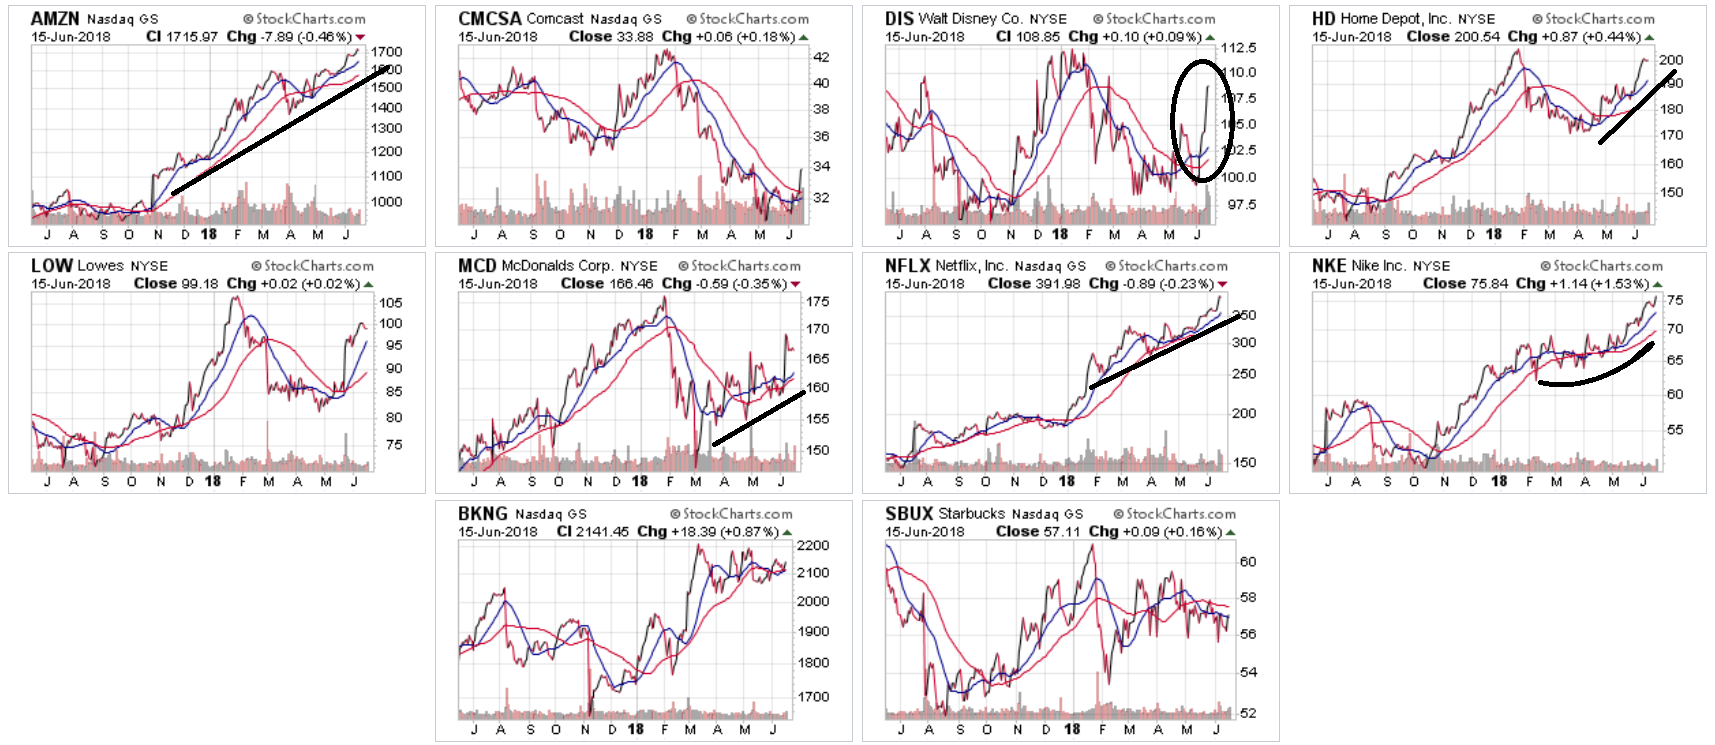
Amazon (NASDAQ:AMZN) is 22% of the index, so its nine-month rally (top row, far left) is disproportionately impacting XLY. Nike (NYSE:NKE) (second row, far right) is also at a 52-week high as is Netflix (NASDAQ:NFLX) (second row, second from the left). Disney (top row, second from the right) popped on the Fox Entertainment news.
Next, let's look at the healthcare sector (NYSE:XLV), starting with the daily chart of its ETF:
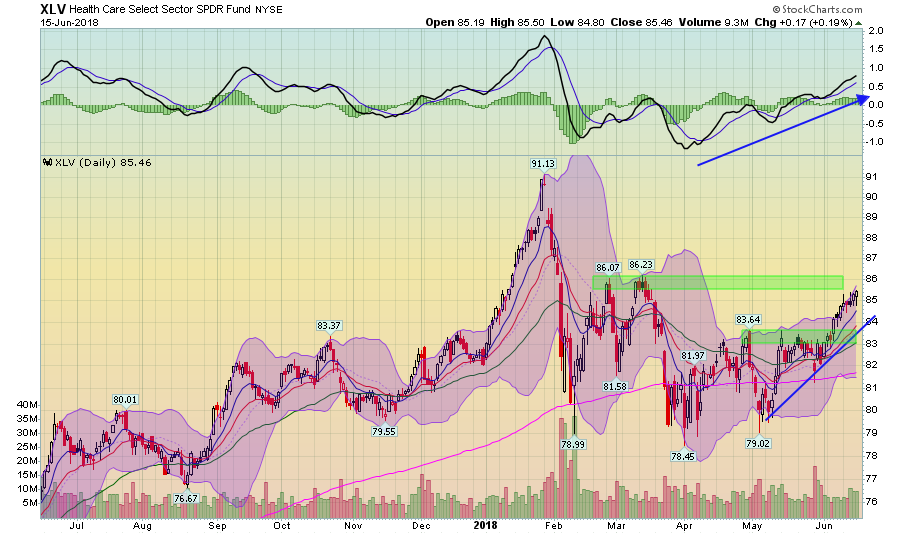
Prices have been in an uptrend since the beginning of May. They have moved through resistance at 83 and are approaching and are moving toward resistance at the 86 level. The shorter EMAs are moving higher and momentum is rising.
Here are the charts of the 10 largest members:
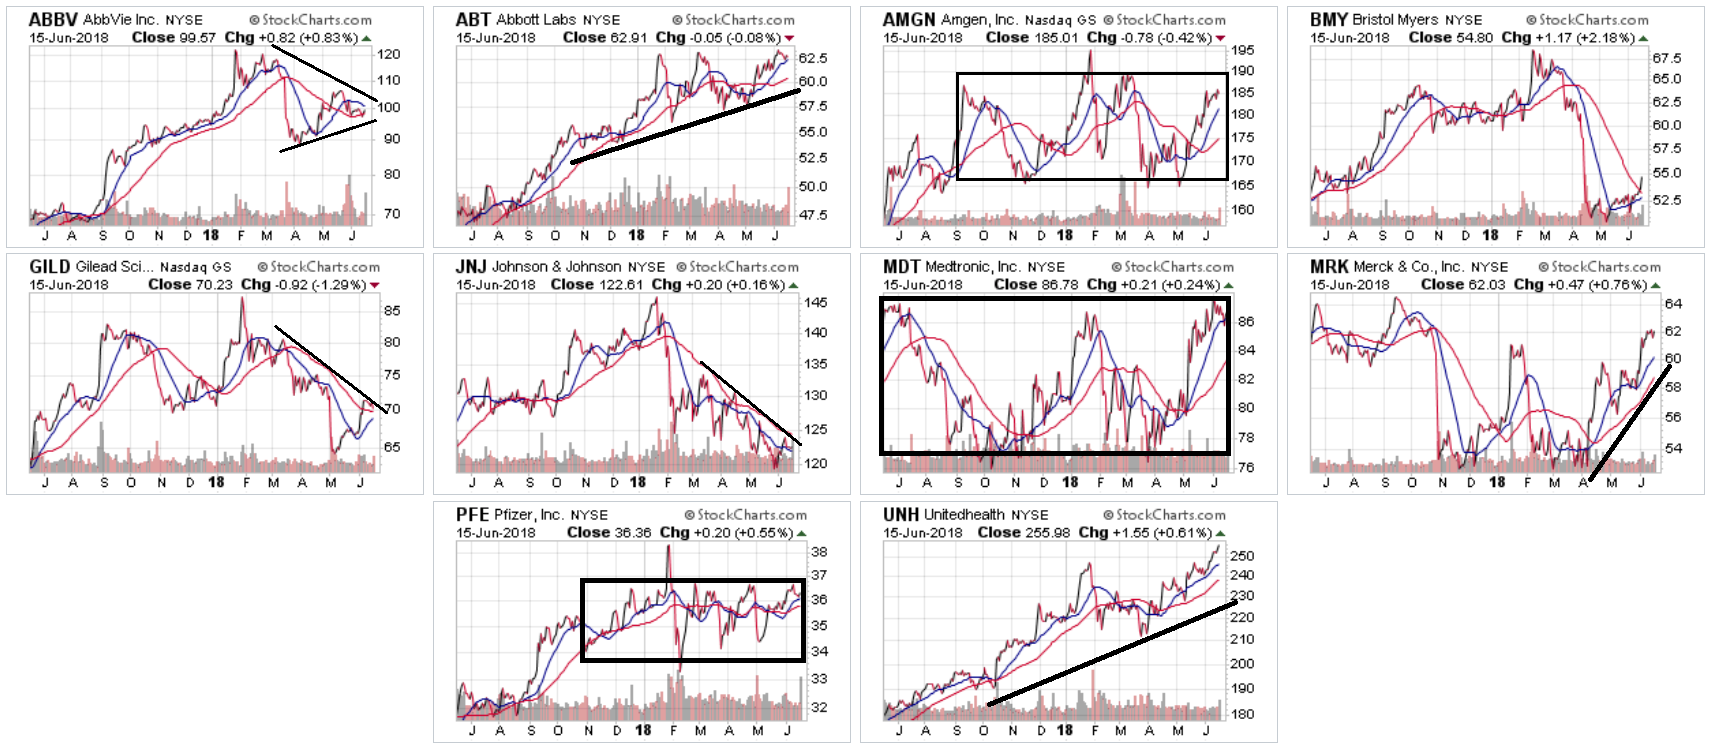
With the exception of UnitedHealth Group Incorporated (NYSE:UNH) (bottom row right) and Abbott Laboratories (NYSE:ABT) (top chart, second from the left), there aren't any major uptrends in this sector. Instead, there's a fair amount of consolidation and bearishness.
This post is not an offer to buy or sell this security. It is also not specific investment advice for a recommendation for any specific person. Please see our disclaimer for additional information.
Disclosure:I/we have no positions in any stocks mentioned, and no plans to initiate any positions within the next 72 hours.
I wrote this article myself, and it expresses my own opinions. I am not receiving compensation for it (other than from Seeking Alpha). I have no business relationship with any company whose stock is mentioned in this article.
