Sector ETF Week In Review For July 1-5
Summary
- The performance was split between defensive and aggressive sectors on the weekly chart.
- Performance is more mixed during the last month and the past three months.
- Defensive sectors have strong charts in multiple time frames.
Let's start with the performance charts, beginning with the last five days (which will include the end of the preceding week):
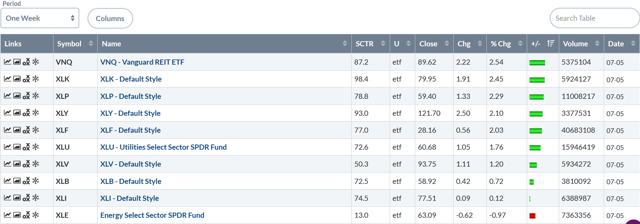
9/10 industry groups advanced - energy was the only sector to decline. The top four spots are evenly split between aggressive and defensive industries. Real estate and technology occupy the top two spots; the performance difference is negligible. Staples and discretionary account for number three and four respectively. Like the top two spots, the performance difference is fractional. The middle section is also split between aggressive and defensive industries.
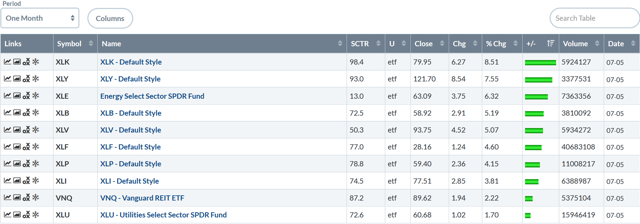
The one-month table is far more aggressive: technology and discretionary occupy the top two spots; energy and basic materials (two additional aggressive, early-cycle sectors) round out the top four. The performance difference is also notable: technology and discretionary (numbers one and two) advanced 8.51% and 7.55% respectively while healthcare (the top-performing defensive sector; number five on the table) rose 5.07%. Defensive industries don't make an appearance until the 5th and 6th position; they also occupy the bottom two rungs. The one-month table is far more aggressive than the last week's table. 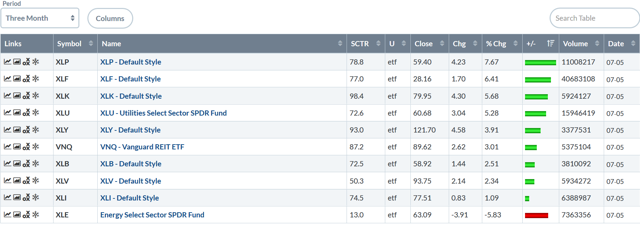
On the three-month chart, the overall performance returns to a more defensive orientation. Staples and financials are the top two performers; the defensive sector outperformed the aggressive sector by over a point. Technology and utilities round out the top four positions; the latter two have little difference in their performance.
Despite the wavering performance, defensive sectors still have very strong charts.
Utilities (XLU)
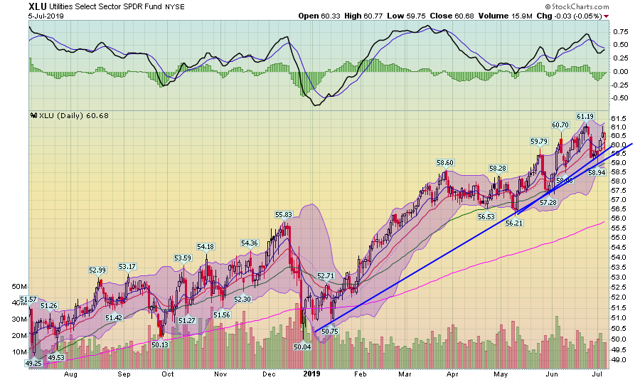
There are two uptrends on XLU's daily chart. The first is six months long and connects lows from early 2019, early May, and late May. The second is only two months long and connects lows from early May, late May, and late June. The chart has printed a series of higher highs. Momentum has fallen a bit, but now has more upside room to move.
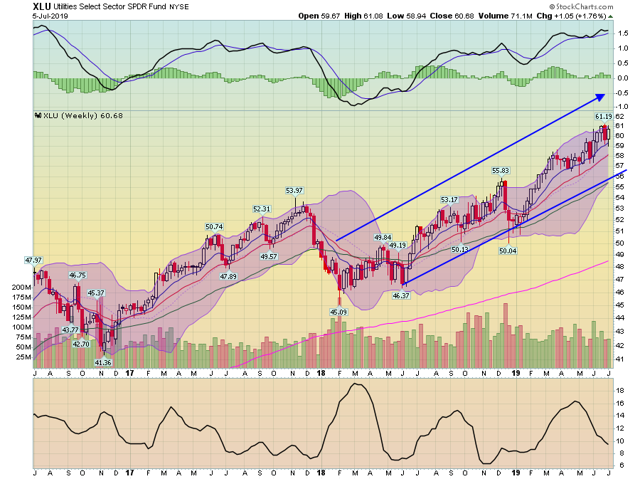
The weekly XLU chart shows two uptrends. The first lasted for a little over a year (late 2016-late 2017) while the second started in early 2018. The moving averages tell a very bullish story: all are rising, the shorter are above the longer, and prices are using the EMAs for technical support.
Real Estate (VNQ)
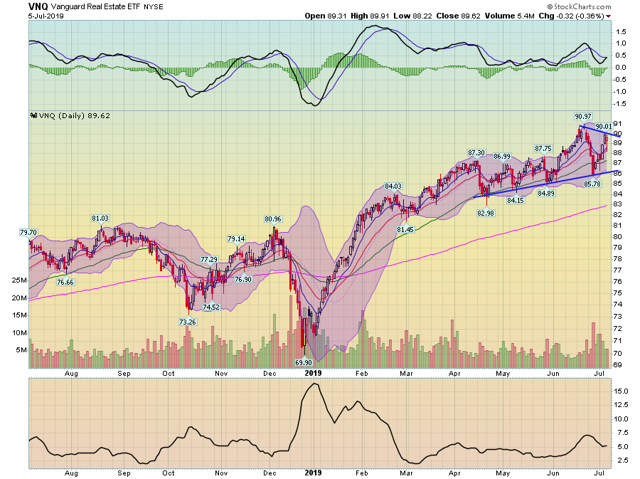
The real estate ETF has a modest uptrend that started in March. But there's a second one that started in early April with a lower slope. It also appears the chart is forming a consolidation pattern starting in mid-June. The MACD has additional room to move higher.
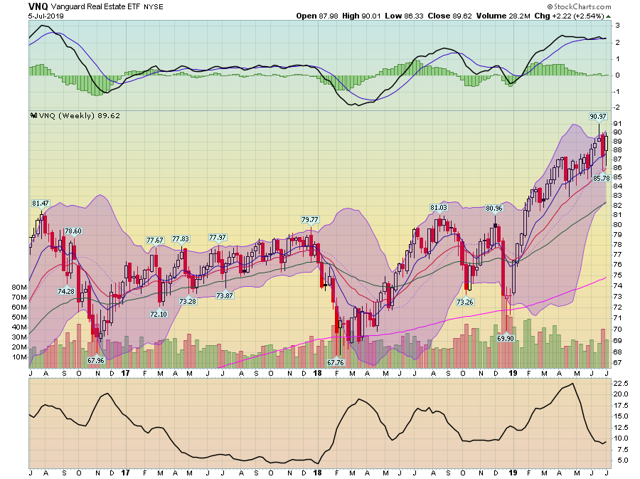
On the weekly chart, prices are now near multi-year highs. As with the utilities chart, the EMAs are bullishly aligned: the shorter are above the longer, all are moving higher, and prices are using the EMAs for technical support.
Consumer Staples (XLP)
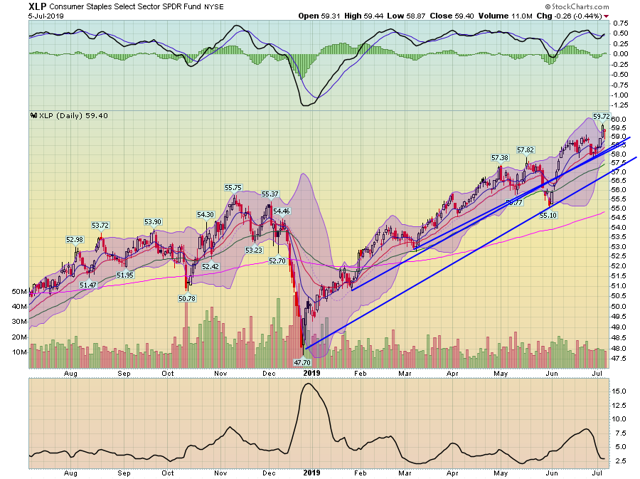
On the consumer staples chart, prices have been in an uptrend since the end of last year. There are several trends: the main uptrend connects lows from late 2018 and early June 2019. Several secondary trends connect lows from a shorter time frame.
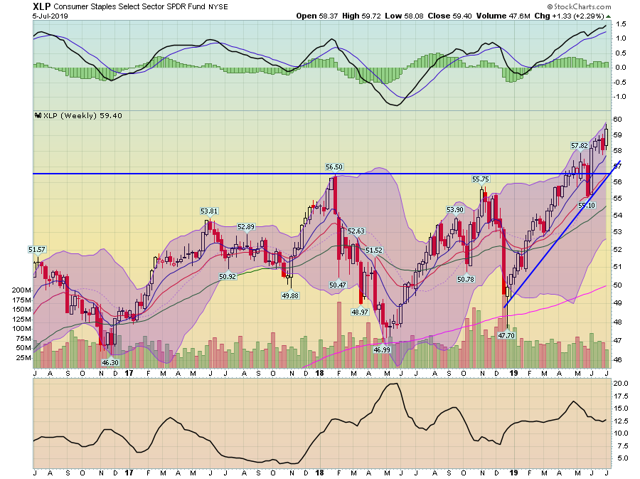
On the weekly chart, XLP has broken through resistance at the 56.50 level and has continued to move higher. Prices closed at a multi-year high this week. Note the bullish EMA picture.
Healthcare (XLV)
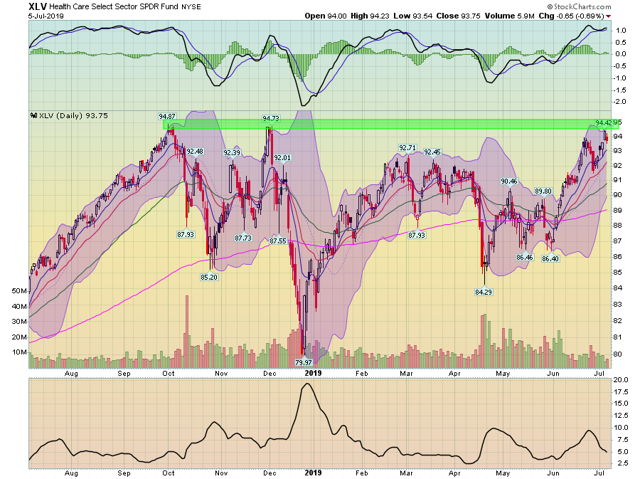
Of all the staples, healthcare has the least attractive chart. Prices were actually trending modestly lower during the spring as both political parties attacked the sector for different reasons. The sector caught a bid in June and is now just shy of a yearly high.
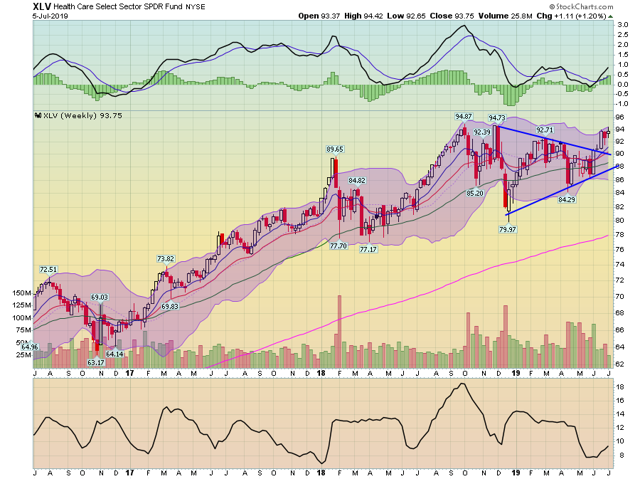
On the weekly chart, the sector has spent the last year consolidating in a triangle pattern before breaking out in the early summer. A move above 95 would indicate the ETF is clearly moving higher.
All these charts show that in multiple time frames defensive sectors have very attractive charts from a technical perspective.
