Scherzer & Co AG (DE:PZSG) NAV closed H119 flat vs end FY18 and declined 3.5% to the end of August. H119 portfolio performance was dominated by weaker results from GK Software and pre-squeeze-out stagnation in Linde’s share price. These two companies made up c 31% of PZS’s portfolio at the peak in March 2019. €22.8m cash inflow from the Linde squeeze-out allowed for deleveraging and increased PZS’s portfolio of extra compensatory claims (ECS) to €139m. We note that PZS is focused on lesser-known stocks and its short-term performance may at times differ from the broader market.
Marginal profit in H119
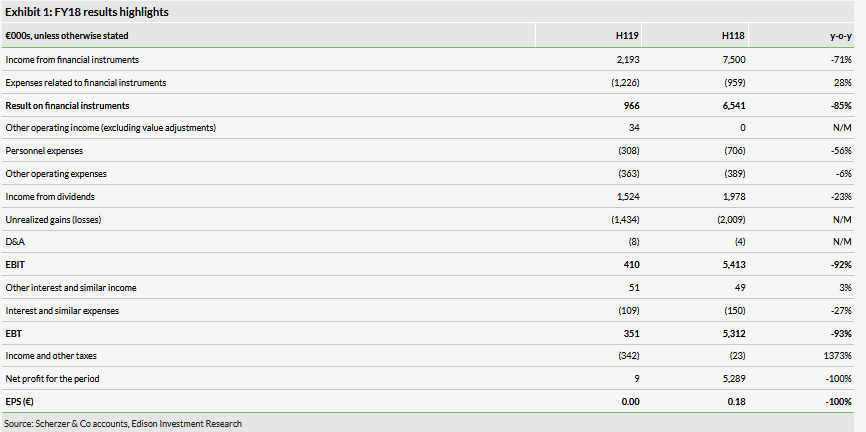
PZS’s net income came in at a minor €9k in H119, which translated into €0.00 EPS, compared to €0.18 a year earlier. Lower income from trading and dividends was only marginally offset by an improved expense ratio at 1.3% of NAV on a last 12-month (LTM) basis (4.9% a year earlier). The net debt to equity ratio stood at 29%, significantly down from 42% in FY18, supported by cash compensation from the Linde squeeze-out. A minor ECS case was also closed during the period, resulting in €77k income for PZS (including interest).
NAV performance behind broad market
As a result of stagnant NAV performance in H119, PZS lagged both the MDAX and SDAX, which posted a c 20% return in the period. PZS’s portfolio focuses on lesser known/understood stocks, as well as companies in special situations. This means the companies often require company-specific catalysts to materially unlock value and do not always move in line with the broader market, calling for a long-term investment approach. It is also worth noting that in H119, a significant part of the portfolio (c 10–20% between the end of 2018 and March 2019) was ‘locked’ in anticipation of the Linde squeeze-out. PZS’s five-year NAV annual total return to end August 2019 stood at 6.4%.
Valuation: In line with NAV movements
PZS has long traded at a discount to NAV of 15% but, following positive catalysts such as the successful sale of FIDOR Bank in 2016, its shares now trade broadly in line with NAV (currently a 4% discount). An additional stock driver could be the pending AXA ECS case. We estimate that the recent, but not yet final, ruling indicates potential income for PZS of €5.7m ex-interest (or at least €8m including interest). NAV does not include any income from potential ECS profits.
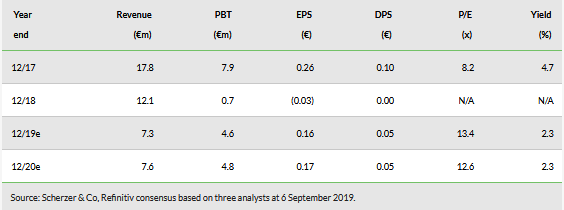
Consensus estimates

Business description
Scherzer & Co (PZS) invests its funds mainly in domestic equities. PZS looks for companies that are unknown or unloved, and special situations. The focus is on special situations, where the downside is perceived to be limited. In addition, it acquires value stocks, mainly below book value. These stocks need to demonstrate strong business models.
Financials: Weaker trading result and high tax charge
PZS reported a minor net profit of €9k in H119 (H118: €5.3m). The weak result is mostly attributable to lower income from financial instruments of €2.2m (down 71% y-o-y), which reflects lower gains on disposals and from derivatives. At the same time, the negative impact of disposal losses amounted to €1.2m (28% higher y-o-y). Consequently, the overall net result on financial instruments was €1.0m (an 85% decrease y-o-y).
Income from dividends was down to €1.5m vs €2.0m in H118 (a 23% y-o-y decrease). Lower dividend and trading income was only marginally offset by a better result on the portfolio valuation of -€1.4m (vs -€2.0m in H118) and 56% y-o-y lower personnel expenses of €0.3m. The LTM expense ratio was lower at 1.3% of average NAV from 4.9% a year earlier. As a result, EBIT reached €0.4m vs €5.4m in H118.
Net income was negatively affected by an abnormally high income tax charge (€342k vs €23k in H118). We understand that the reasons for the high tax rate were the same as in H218, which was associated with the disposal of stakes in the current portfolio acquired prior to 2017. We explained this in more detail in our last note, highlighting that this tax effect should diminish as a result of regulatory changes.
In the ECS portfolio, PZS reported €71k income from the Strabag case (included in income from financial instruments) and received €22.8m in cash compensation from the Linde squeeze-out, with no impact on profit. Linde shares traded above the squeeze-out price over the notice period and management highlights that if PZS sold its shares in the market (rather than participating in the actual squeeze-out process), it would result in a net gain of €0.9m. We understand that PZS used the cash proceeds to reduce its net debt position to €16.5m (H118: €30.3m), with the current net debt to equity ratio at 29% vs 42% at end 2018 and 48% at end June 2018.


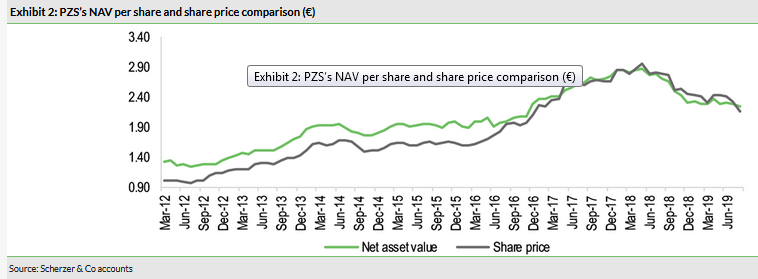
PZS’s NAV at the end of H119 was the same as at end 2018, with no dividend paid in the period. The LTM total NAV return at end June 2019 was -16.6%, as the value of the portfolio did not rebound following the broader market deterioration in late 2018. Consequently, PZS underperformed the market significantly in H119, as the DAX, MDAX and SDAX posted returns of 17%, 19% and 20% respectively. Including NAV development post balance sheet date, the year-to-date total NAV return (to the end of August 2019) was -3.5%. PZS’s NAV progression (ex-dividends) is shown in Exhibit 2.
PZS’s current ECS portfolio is not included in the NAV value, but is reflected in NAV on successful closures in the amount of income realised. Returns are at least partially reinvested in the portfolio and contribute to long-term NAV development. During H119, the ECS portfolio expanded by €22.8m to €139m due to the aforementioned squeeze-out at Linde. We note that the ECS portfolio is expressed as the value of compensation received on squeeze-outs. So far this year, only a small transaction at Strabag was concluded. More importantly, in August 2019, the first instance ruling in the AXA 2006 case (the largest ECS held by PZS) confirmed the fair value was above the squeeze-out price. We estimate that if the AXA case was resolved according to first instance ruling, it would translate to a gain for PZS of c €5.7m excluding interest (or at least €8m including interest), which represents a per share amount of €0.19 (or at least €0.27). That said, the current ruling is not final, and it is likely the dispute will be considered in a higher court.
Portfolio developments
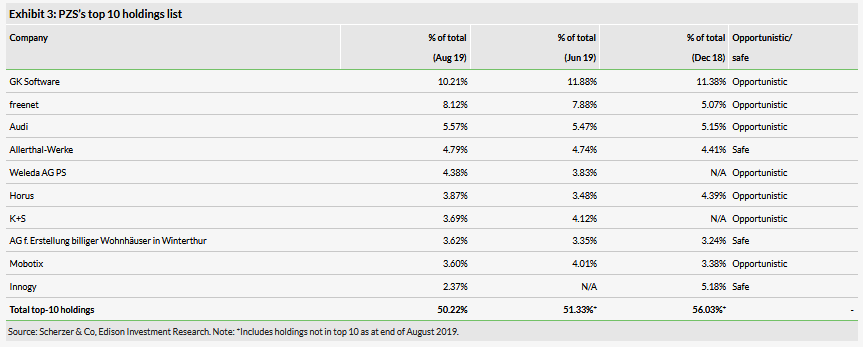
Scherzer divides its portfolio into two categories: opportunistic and safe. In either category, PZS focuses on lesser-known companies with limited or no research coverage, as well as companies with business models that are difficult to evaluate which tend to be underappreciated by the broad market. ‘Safe’ companies are characterised by high asset quality with sustainable earnings, whereas the ‘opportunistic’ category consists mostly of companies in special situations such as restructuring or M&A. At end H119, 61% of portfolio was classified as ‘opportunistic’ (FY18: 53%) and 39% as ‘safe’ (FY18: 47%). We believe such a portfolio positioning may in some instances result in a significant diversion from the broader trend in equity markets (as experienced so far this year) and calls for a more long-term investment approach. This year in particular, we see several factors contributing to NAV underperformance.
Firstly, PZS sometimes acquires equity stakes in anticipation of a squeeze-out. There is limited room for price appreciation once the squeeze-out has been announced. A good example of this is PZS’s investment in Linde. The company increased its stake prior to the squeeze-out, which was concluded in April 2019. As a result, the holding represented 21% of PZS’s portfolio at end March 2019 (vs 11% at end 2018). The squeeze-out price of €189.46 per share was approved around mid-December 2018, which limited Linde’s subsequent share price movement, and the majority of cash proceeds from the squeeze-out were used for deleveraging rather than reinvestment. Examples of other stocks included in the portfolio that represent potential squeeze-out candidates are Audi (5.5% of portfolio at end June), Lotto24 (2.6% at end June) and Innogy (2.4% at end August).
GK Software (PZS’s largest holding with 10.2% share at end August 2019) seems to be drifting further away from achieving its targeted 15% EBIT margin by 2020, posting a €5.0m EBIT loss in H119 on the back of product development costs. Also, it recently carried out a €5.1m equity issue at a price of €64 per share. In the case of some other portfolio holdings (eg K+S and freenet), the business headwinds experienced in FY18 seem to have weighed on investor sentiment towards the shares this year, despite an overall stable business performance.
Finally, we note that PZS has a number of less liquid stocks in the portfolio, such as Weleda and AG f. Erstellung billiger Wohnhäuser in Winterthur, which are trading on OTC markets. In addition, PZS holds significant stakes in companies with similar or adjacent business models, eg Allerthal-Werke, RM Rheiner Management and the majority-owned Horus.

Valuation
PZS’s NAV was €2.23 per share at end August 2019 and the current share price of €2.14 implies a 4% discount. Before the favourable Schering ECS ruling in 2015, PZS’s shares tended to trade at a c 15% discount to NAV. PZS realised extra compensation of around 12x the initial investment in Schering and the discount has subsequently tightened close to zero. We believe the Schering ruling improved investor acceptance of potential gains resulting from the ECS portfolio. Nevertheless, there is no visibility on future gains from the ECS portfolio, which may explain why PZS has been trading at a visible discount to the market average based on the P/E ratio.

Asset management company valuations are commonly based on asset value, which can be demonstrated by the price to book (P/BV) value. We have analysed the development of P/BV ratios and a decline in PZS’s discount to the market has been apparent since 2015, reaching 17% at end 2018. Since 2017, PZS has mostly traded at a premium to its equity value per share.
Under German reporting standards, NAV development is not fully reflected on the balance sheet. Although a decrease in the market price of the portfolio is reflected through write-offs, increases are only recognised on disposals. The company can only report positive value adjustments by reversing write-offs and in effect the book value of the portfolio cannot exceed the initial investment.
