Investors in U.S. markets can get exposure to Saudi equities through at least two ETFs. The iShares MSCI Saudi Arabia ETF (NYSE:KSA) has almost 100% exposure to the Tadawul, while the WisdomTree Middle East Dividend (NASDAQ:GULF) has approximately 27% exposure, according to ETF Database.
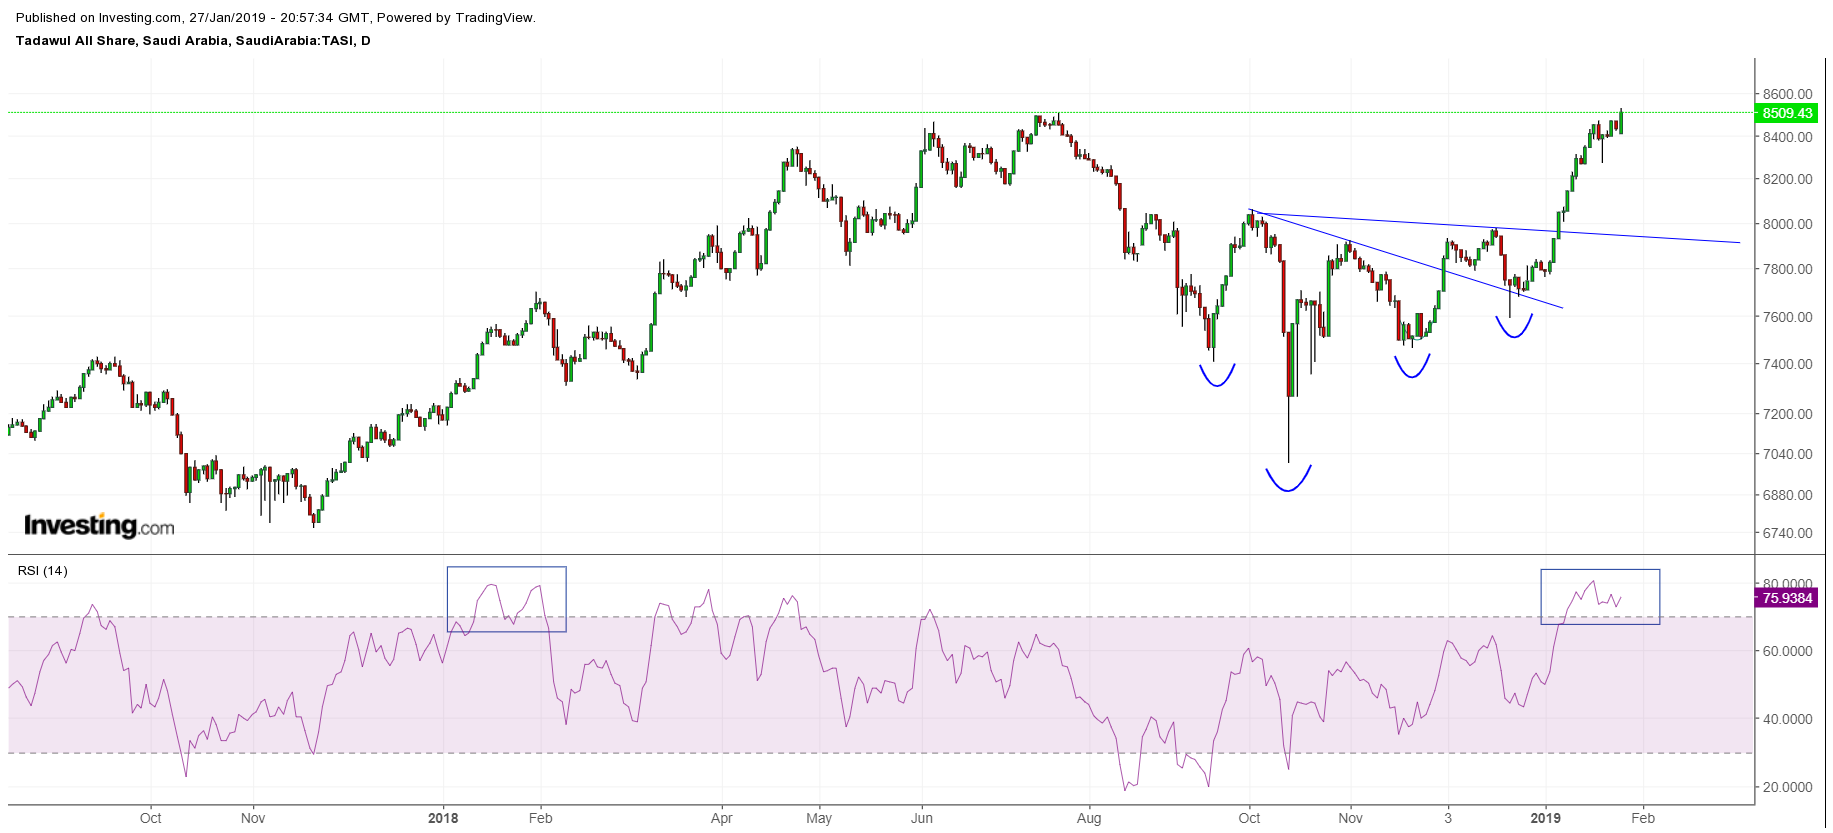
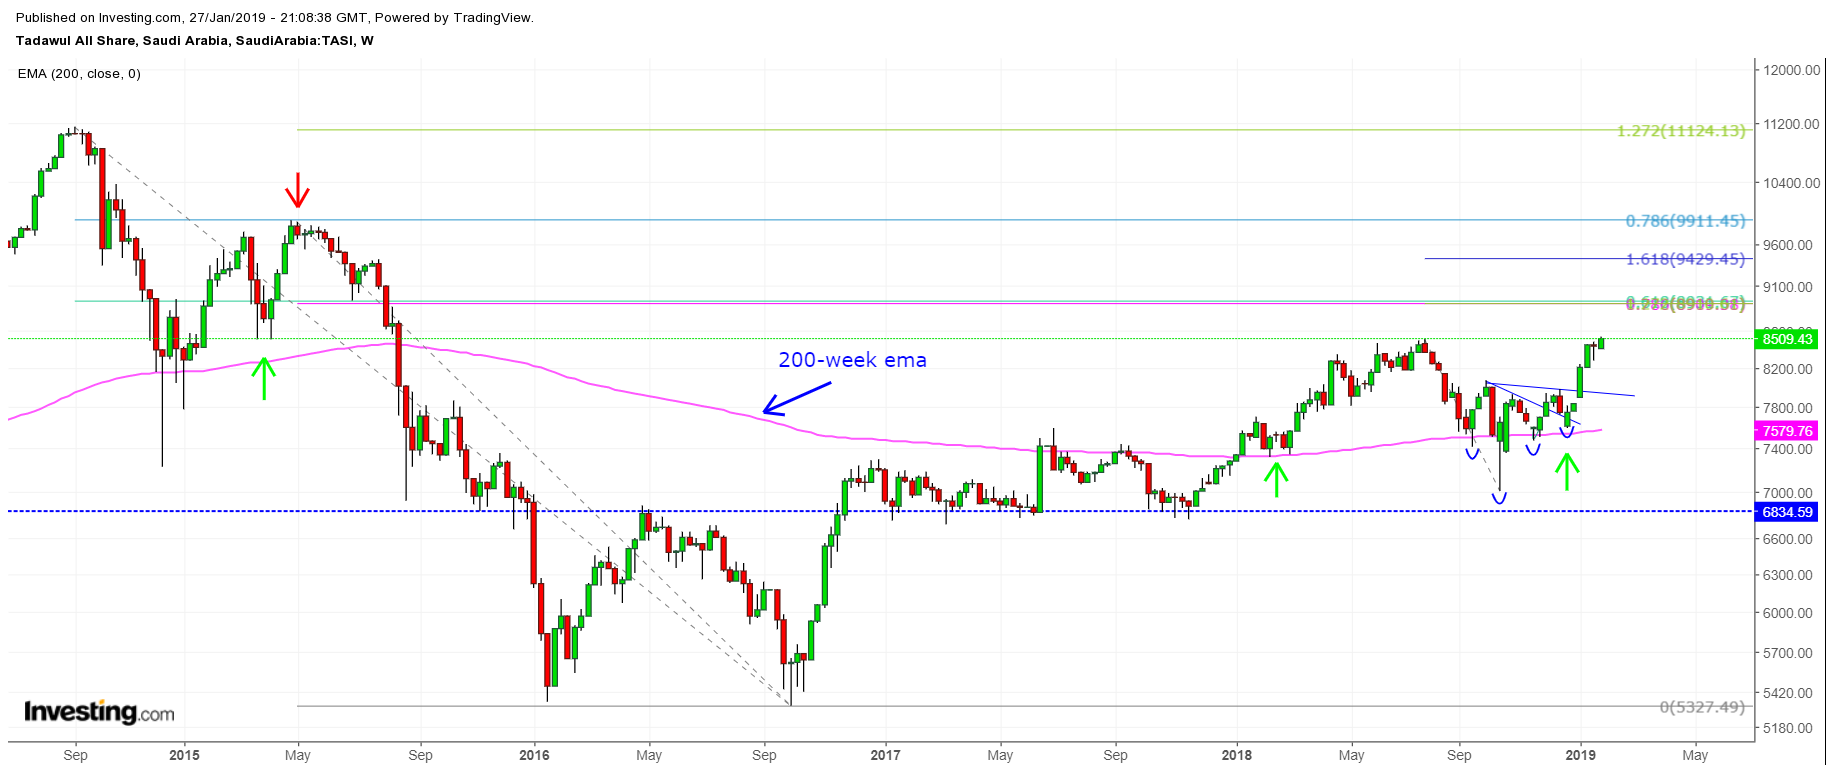
As of Sunday's 8,528.30 trend high, the Tadawul All Share Index (TASI) has rocketed over 12% in 25 trading days, when counting from the swing low of 7,589.23 on December 23. A long-term bullish trend continuation signal was triggered on the move as the day’s close was at 8,509.43, just above the most recent peak of 8,502.92 from July 2018. Further, yesterday’s close was the highest daily closing price since August 2015.

During the rally, the index broke out of a head and shoulders bottom trend reversal pattern with a complex right shoulder. You can see from the chart below that there was first a breakout of a head & shoulders bottom as the price went through the lower neckline in early-December. Then, the formation continued to evolve, creating a second right shoulder. This led to a breakout of the second neckline three weeks ago. Given that yesterday’s high was just barely above the July peak, it remains to be seen if some resistance may still be seen before the TASI continues higher.
This is all very bullish behavior. Nevertheless, the TASI may have gotten ahead of itself and needs to take at least a short rest before moving higher. Given the rapid ascent over the past five weeks and the fact that the index is hitting potentially significant resistance, it seems like there is a good chance for some sideways movement or a pullback before the TASI is ready to sustain upward momentum. Also, the 14-day Relative Strength Index (RSI) momentum oscillator is well overbought at this point.

Either way, it would be healthy for the advance if the index took a bit of a rest before progressing. This would also give investors a chance to prepare for the next run, as a continuation of the long-term uptrend that began off the October 2016 low. Regardless, so far there is no sign that the TASI will stall or pullback in a more significant fashion than last week’s relatively sideways movement. Investors should be prepared, nevertheless.
