
Sallie Mae (NASDAQ:SLM) delivered third-quarter 2019 positive earnings surprise of 16%. Core earnings of 29 cents per share surpassed the Zacks Consensus Estimate of 25 cents. Moreover, the figure jumped 24% from the prior-year quarter.
Increase in net interest income and elevated non-interest income were tailwinds. Deposits and loans grew considerably and capital position was strong. However, these positives were offset by elevated expenses and poor credit quality.
The company’s GAAP net income attributable to common stock came in at $124 million compared with $100 million a year ago.
Net Interest Income Increases, Expenses Escalate
Net interest income for the third quarter came in at $405 million, up 13.4% year over year. This improvement was mainly driven by higher interest income. Net interest margin contracted 45 basis points (bps) to 5.55%.
The company reported non-interest income of $17 million against non-interest loss of $86 million in the prior-year quarter. This upside stemmed from higher gains on derivatives and hedging activities and other income.
The company’s non-interest expenses jumped 1.9% year over year to $153.6 million. The upsurge mainly resulted from increased compensation and benefits expenses.
Efficiency ratio, on a non-GAAP basis, decreased to 36.6% from 54.7%. Generally, a lower ratio indicates improved profitability.
Credit Quality Worsens
Provision for loan losses was $99 million, up 41.4% from $70 million witnessed in the prior-year quarter.
Delinquencies as a percentage of private education loans in repayment were 2.8%, up 5 bps.
Loans & Deposits Grow
As of Sep 30, 2019, deposits of Sallie Mae Bank were $22.6 billion, up from $21.2 billion as of Jun 30, 2019. Increase in retail and other, along with brokered deposits, contributed to this upside.
Private education loan portfolio was $22.9 billion, up nearly 7% sequentially. Average yield on the loan portfolio was 9.30%, down 9 bps.
Strong Capital Position & Capital Deployment Update
As of Sep 30, 2019, Sallie Mae Bank’s common equity Tier 1 capital was 11.5%, exceeding the “well capitalized” industry benchmark in regulatory requirements.
The company repurchased $37 million of common stock under share repurchase program at an average price of $8.45.
2019 Outlook
The company expects core earnings per share to be between $1.23 and $1.24 for this year, up from $1.21-$1.23 expected previously.
Private education loan originations are projected to be $5.7 billion. The company’s full-year non-GAAP operating efficiency ratio is expected in the 35-36% band.
Our Viewpoint
Results of Sallie Mae highlight continued focus on increasing private education loan assets, maintaining a solid capital position by introducing multiple complementary products and improving efficiency. Also, significant rise in non-interest income is a tailwind.
We believe improving economic conditions will further assist Sallie Mae in maintaining its leading position in the student lending market. Additionally, its focus on solidifying presence in the consumer banking business space bodes well. However, worsening of credit quality and escalating expenses keep us apprehensive.
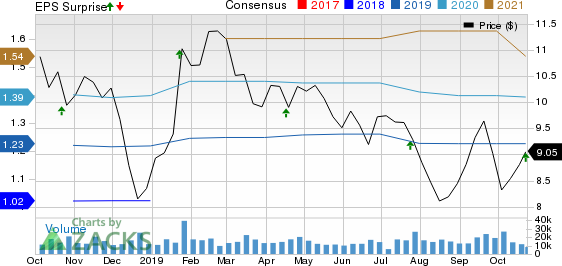
SLM Corporation Price, Consensus and EPS Surprise
Currently, Sallie Mae carries a Zacks Rank #3 (Hold). You can see the complete list of today’s Zacks #1 Rank (Strong Buy) stocks here.
Performance of Other Banks
Synovus Financial’s (NYSE:SNV) reported third-quarter 2019 adjusted earnings of 97 cents per share lagging the Zacks Consensus Estimate of $1. However, the bottom line was 2.9% higher than the prior-year quarter figure.
Reflecting top-line strength, Northern Trust Corporation’s (NASDAQ:NTRS) third-quarter 2019 earnings per share of $1.69 outpaced the Zacks Consensus Estimate of $1.64. Also, the earnings figure compares favorably with the year-ago quarter’s $1.58.
Navient Corporation (NASDAQ:NAVI) pulled off a positive earnings surprise of 10.7% in third-quarter 2019. Core earnings per share of 62 cents surpassed the Zacks Consensus Estimate of 56 cents. Also, the bottom line came in higher than the year-ago quarter figure of 53 cents.
Today's Best Stocks from Zacks
Would you like to see the updated picks from our best market-beating strategies? From 2017 through 2018, while the S&P 500 gained +15.8%, five of our screens returned +38.0%, +61.3%, +61.6%, +68.1%, and +98.3%.
This outperformance has not just been a recent phenomenon. From 2000 – 2018, while the S&P averaged +4.8% per year, our top strategies averaged up to +56.2% per year.
See their latest picks free >>
Northern Trust Corporation (NTRS): Free Stock Analysis Report
Synovus Financial Corp. (SNV): Free Stock Analysis Report
SLM Corporation (SLM): Free Stock Analysis Report
Navient Corporation (NAVI): Free Stock Analysis Report
Original post
Zacks Investment Research