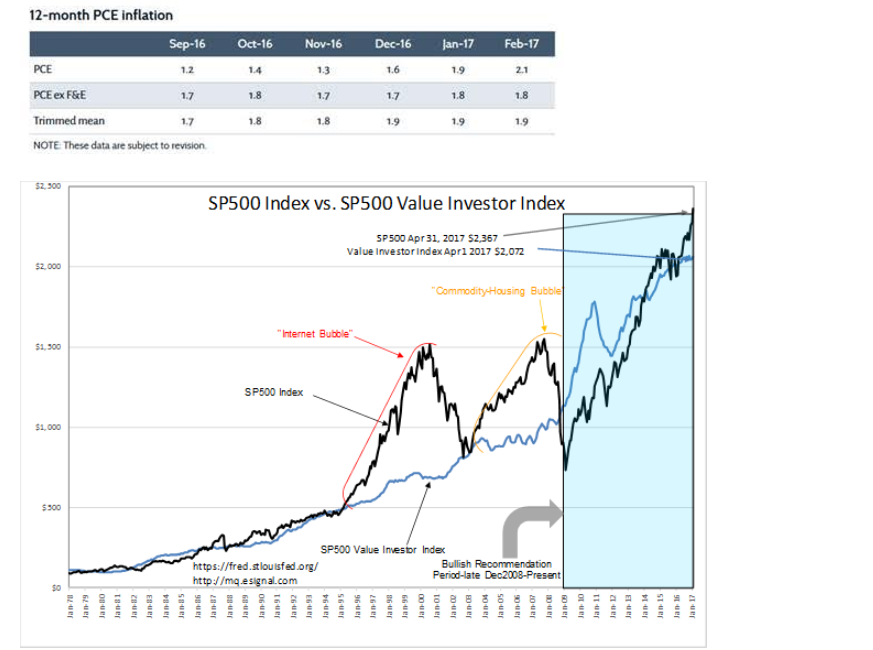
The important takeaway here is that while the market itself is not “cheap” (there is still tons of “value” out there), it is in no way in a “bubble”. Past market peaks have had the S&P 60% to 100% above its intrinsic value. For those who do not want to do the math, that means S&P at 3,315 to 4,144. In other words, this things has got a lot of legs to go before we need need to panic about “bubble”.
“Davidson” submits:
In my own research, I keep track of the Knut Wicksell “Natural Rate” and the pricing of the SP500 relative to this rate. I use Wicksell’s original description of the “Natural Rate” which is described as an economic rate of return across multiple economic cycles.
Wicksell’s perception was that of investors pricing markets to the “Natural Rate” over multiple economic cycles with mispricing occurring frequently. Mispricing is due to investor misperception in matching business returns and market prices. The conversion of Wicksell’s concept into modern market prices is the SP500 Value Investor Index. The Fed’s discussion of the “Natural Rate” in relationship to short-term rates is one of the Fed’s significant misperceptions. The “Natural Rate” can only be identified and measured using multi-decade periods and has little in common with setting the Fed Funds rates.
The SP500 Value Investor Index takes the long-term SP500 Earnings Trend and divides this by the combined Real Private GDP (Real GDP minus Government Expenditure&Investment) + 12mo Trimmed Mean PCE. It works quite well at identifying the major market lows where the highest Value Investor buying takes place. Thus the name “SP500 Value Investor Index”. This indicator, while helpful at identifying market cycle lows, does not identify major market tops. For market/economic tops, the best indicator in my opinion is when the T-Bill/10yr Treasury rate spread falls below 0.20%.
https://www.dallasfed.org/research/pce.aspx

The Dallas Fed reported the Feb 2017 12mo Trimmed Mean PCE at ~1.9%. When factored into the SP500 Value Investor Index, it can be seen that the SP500 is ~15% higher. The two most recent major market peaks occurred with 60%-100% SP500 excess valuations to the SP500 Value Investor Index. At this point in the cycle, current SP500 levels are not historically over priced.
Those calling for another financial collapse including huge losses in the SP500 do so without fundamental understanding of market pricing over many decades. Even though Hedge Funds could create a panic and drop prices significantly, the historic Value Investor support level is $2,072. There are many good ideas to invest in cheaply today. I have discussed them in notes as general examples in various sectors.
I remain very positive on LgCap Domestic and Intl Equities as well Natural Resources.