Get 40% Off
🚨 Volatile Markets? Find Hidden Gems for Serious OutperformanceFind Stocks Now

S&P 500 Tops 1923, Now What?

Published 06/03/2014, 07:47 AM
Updated 05/14/2017, 06:45 AM

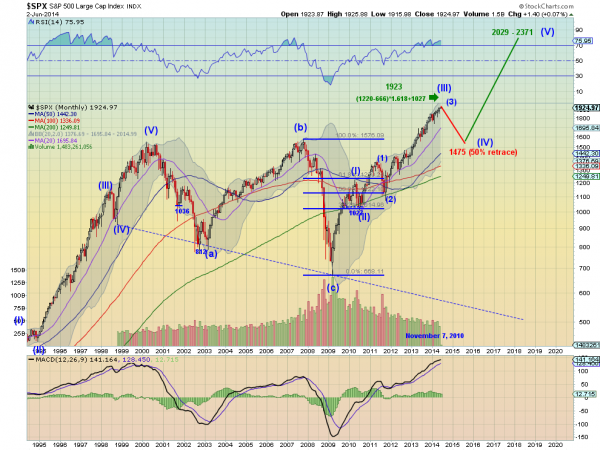
I have been using this monthly Elliott Wave chart on the S&P 500 as a guide for nearly 4 years now. Pulling it out occasionally to remind traders of the big picture and how far the trend can run. Back in November 2010 I measured a 161.8% extension of the first leg higher after the financial crisis to get a possible target of 1923 for the S&P 500. This was a high level analysis. It has now hit that target. So is it time to sell everything? No, not yet. Keeping it high level here are a few reasons why.

S&P 500

  1. The market is still rising. Why would you sell stocks that are rising? You should already have stops in place. Just continue to honor them.
  2. The 161.8% extension is just a guideline. Elliott Wave enthusiasts know that Wave (III) is usually the longest, but there is no rule that it cannot be 200% of Wave (I) or even more.
  3. Wave (IV) was drawn as a 50% pullback of Wave (III), but this is likely wrong. Enthusiasts again would know that Wave (II) and Wave (IV) tend to have different character. If one is corrective the other tends to be flat. So as Wave (II) was corrective in this case, Wave (IV) would be expected to be flat.

Elliot Wave would suggest that when the end of Wave (III) is reached then we can expect some sideways action for a while before a Wave (V) thrust higher. None of this is a guarantee, but do you really want to just blindly sell now?

3rd party Ad. Not an offer or recommendation by Investing.com. See disclosure here or remove ads .

There are many other features here that you could use to analyze this chart. But keeping it simple and high level, it is not time to sell yet.

The information in this blog post represents my own opinions and does not contain a recommendation for any particular security or investment. I or my affiliates may hold positions or other interests in securities mentioned in the Blog, please see my Disclaimer page for my full disclaimer.

 

Latest comments

Risk Disclosure: Trading in financial instruments and/or cryptocurrencies involves high risks including the risk of losing some, or all, of your investment amount, and may not be suitable for all investors. Prices of cryptocurrencies are extremely volatile and may be affected by external factors such as financial, regulatory or political events. Trading on margin increases the financial risks.
Before deciding to trade in financial instrument or cryptocurrencies you should be fully informed of the risks and costs associated with trading the financial markets, carefully consider your investment objectives, level of experience, and risk appetite, and seek professional advice where needed.
Fusion Media would like to remind you that the data contained in this website is not necessarily real-time nor accurate. The data and prices on the website are not necessarily provided by any market or exchange, but may be provided by market makers, and so prices may not be accurate and may differ from the actual price at any given market, meaning prices are indicative and not appropriate for trading purposes. Fusion Media and any provider of the data contained in this website will not accept liability for any loss or damage as a result of your trading, or your reliance on the information contained within this website.
It is prohibited to use, store, reproduce, display, modify, transmit or distribute the data contained in this website without the explicit prior written permission of Fusion Media and/or the data provider. All intellectual property rights are reserved by the providers and/or the exchange providing the data contained in this website.
Fusion Media may be compensated by the advertisers that appear on the website, based on your interaction with the advertisements or advertisers.
© 2007-2024 - Fusion Media Limited. All Rights Reserved.