This morning the S&P 500 seemed to reiterate its misgivings about Trump's churlish demeanor during his first post-election press conference. The index opened lower and plunged to its -0.93% intraday low about 90 minutes into the trade. A buy-the-dip strategy then steadily lifted the 500 to its fractional -0.21% close, a tad below the -0.16% intraday high shortly before the bell.
Here is a snapshot of the past five sessions (note: our Stockcharts.com source offered no response to our query about the missing intraday volume on Monday).
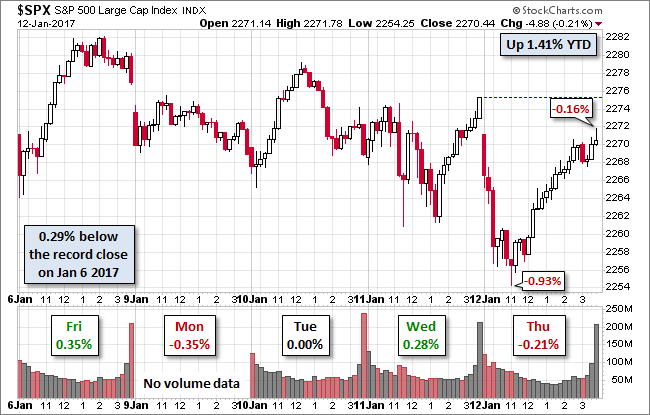
The yield on the 10-year note closed at 2.36%, down two BPs from the previous close.
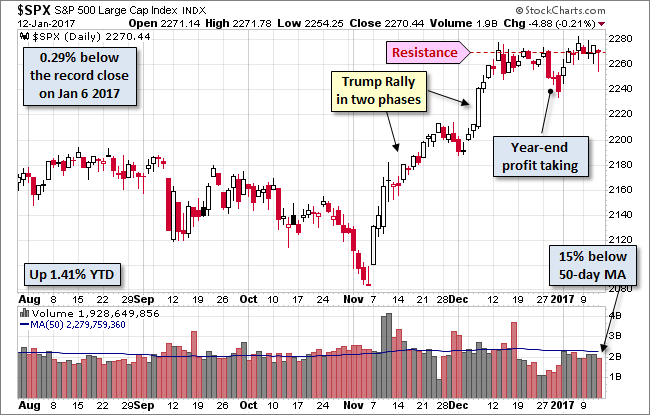
Here is a daily chart of the index. Despite Friday's record close, the two-staged Trump rally has essentially stalled at a line of resistance.
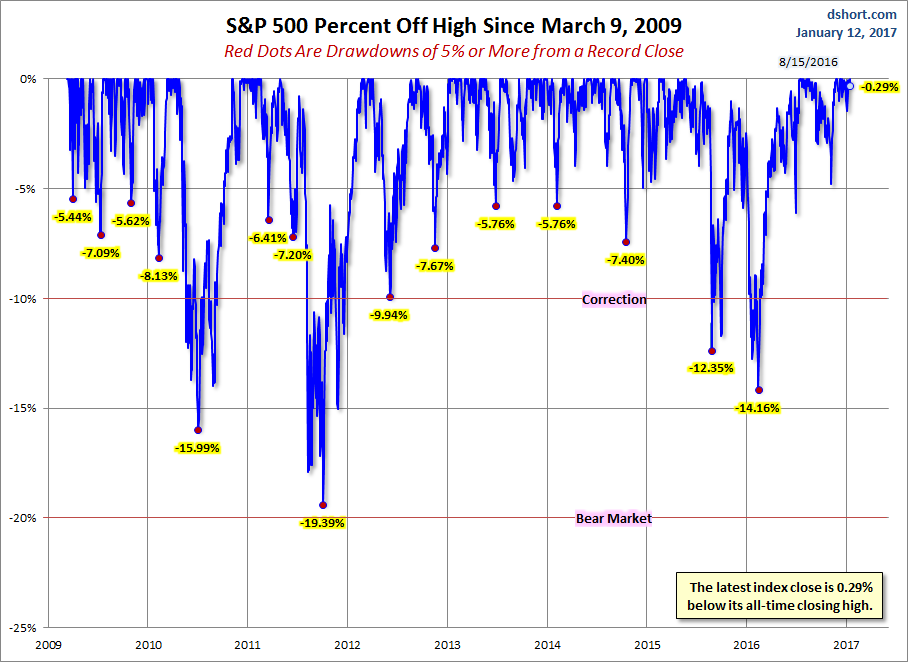
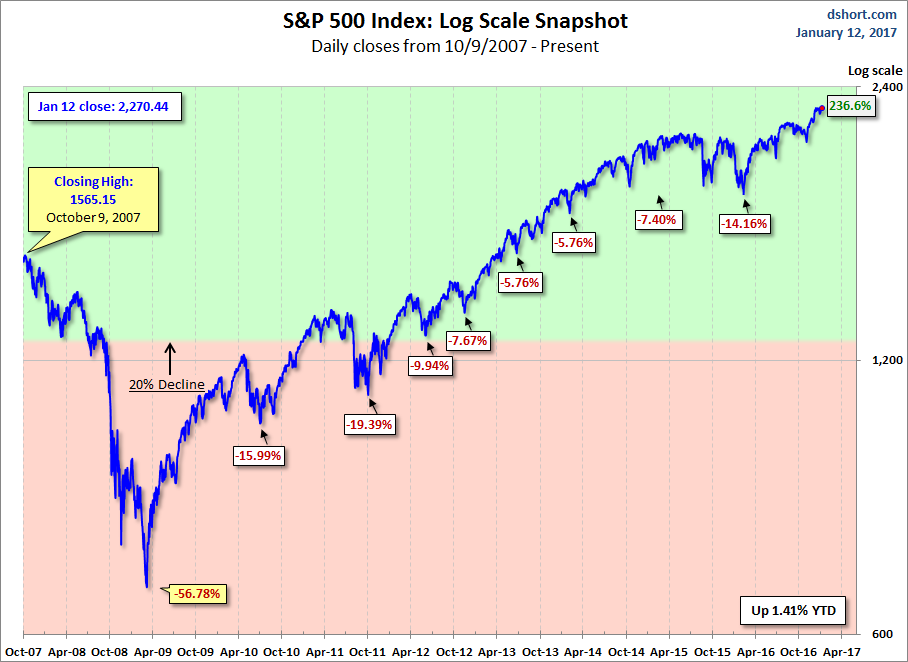
A Perspective on Drawdowns
Here's a snapshot of record highs and selloffs since the 2009 trough.
Here is a more conventional log-scale chart with drawdowns highlighted.
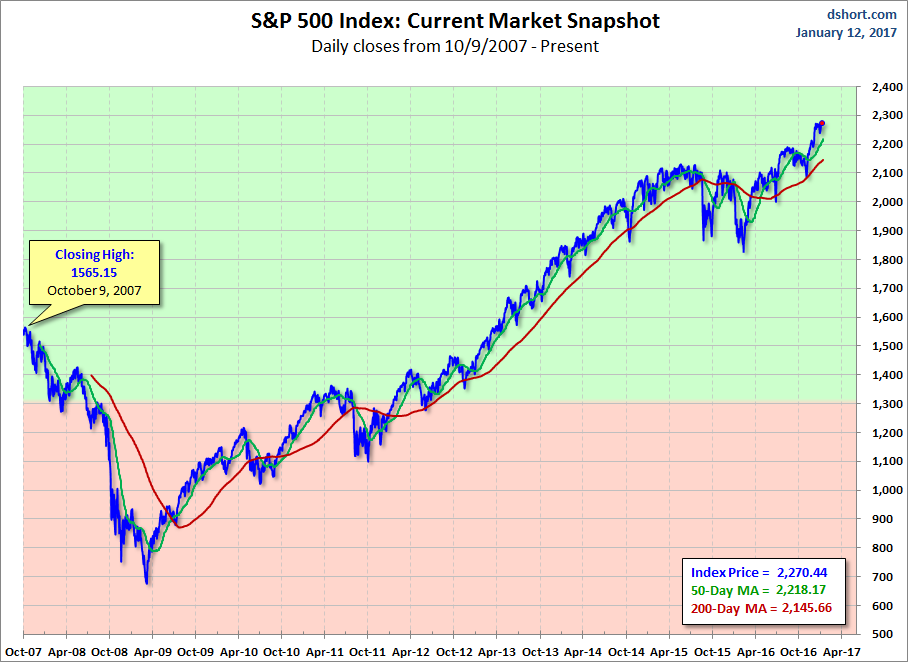
Here is a linear scale version of the same chart with the 50- and 200-day moving averages.
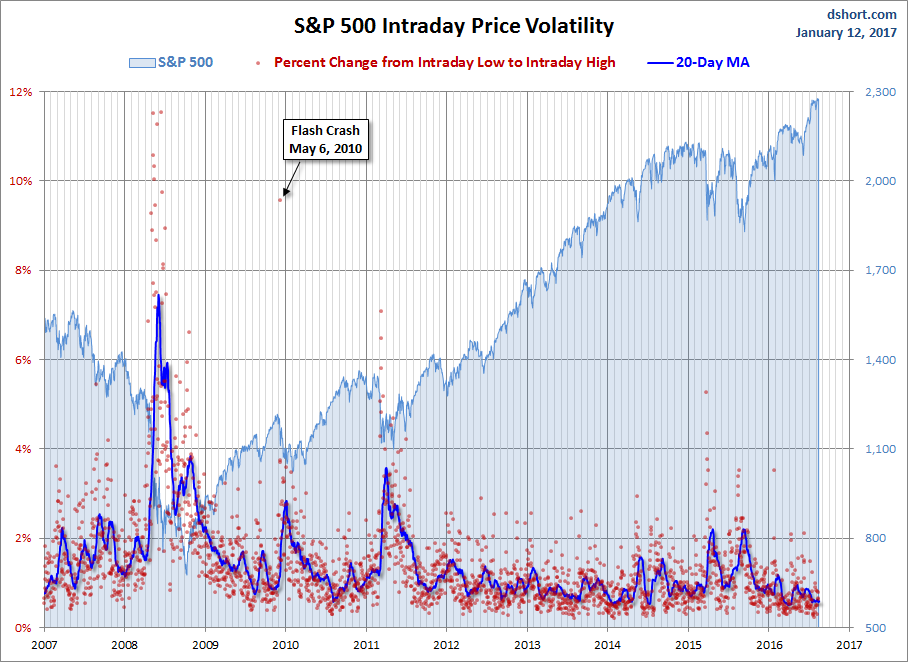
A Perspective on Volatility
For a sense of the correlation between the closing price and intraday volatility, the chart below overlays the S&P 500 since 2007 with the intraday price range. We've also included a 20-day moving average to help identify trends in volatility.