Get 40% Off
👀 👁 🧿 All eyes on Biogen, up +4,56% after posting earnings. Our AI picked it in March 2024.
Which stocks will surge next?
Unlock AI-picked Stocks

S&P 500 Snapshot: A Modest Gain On A Volatile Trump Trade

Published 01/12/2017, 12:42 AM
Updated 07/09/2023, 06:31 AM

The S&P 500 spent the day in a relatively ho-hum 0.64% trading range from its -0.36% low to its modest 0.28% closing gain, but the morning was quite volatile. Why? President-elect Donald Trump held his first press conference since the election, and it was a doozy. His claim that the drug industry is "getting away with murder" sent the index to its intraday low. He also made the astonishing claim that there are 96 million people wanting a job who can't get one, a claim that was debunked by Steve Liesman at CNBC. But the 500 began an early afternoon rally that took it to its closing gain of 0.28%, which was also the intraday high and just 0.07% below its record close on Friday.

Here is a snapshot of the past five sessions (note: our Stockcharts.com source offered no response to our query about the missing intraday volume on Monday).
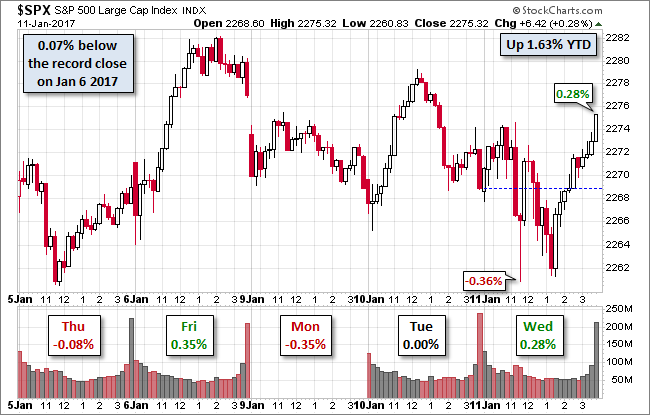
S&P 500: Snapshot of past 5 sessions

The yield on the 10-year note closed at 2.38%, unchanged from the two previous closes.

Here is a daily chart of the SPY (NYSE:SPY) ETF, which gives us a better sense of investor participation than the underlying index. From the week before Christmas, only one session, the last market day of 2016, had trading volume above the 50-day moving average.
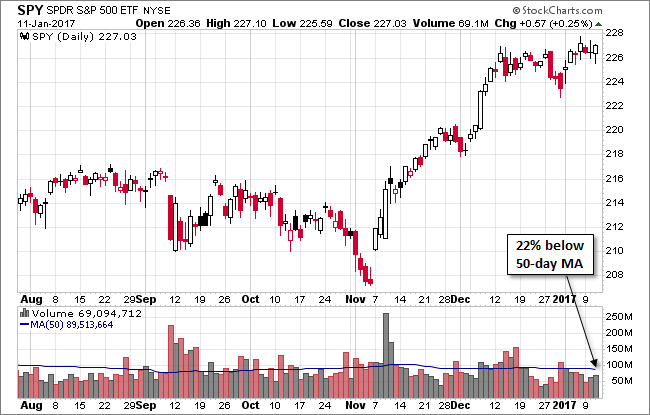
SPY Daily Chart

A Perspective on Drawdowns

Here's a snapshot of record highs and selloffs since the 2009 trough.
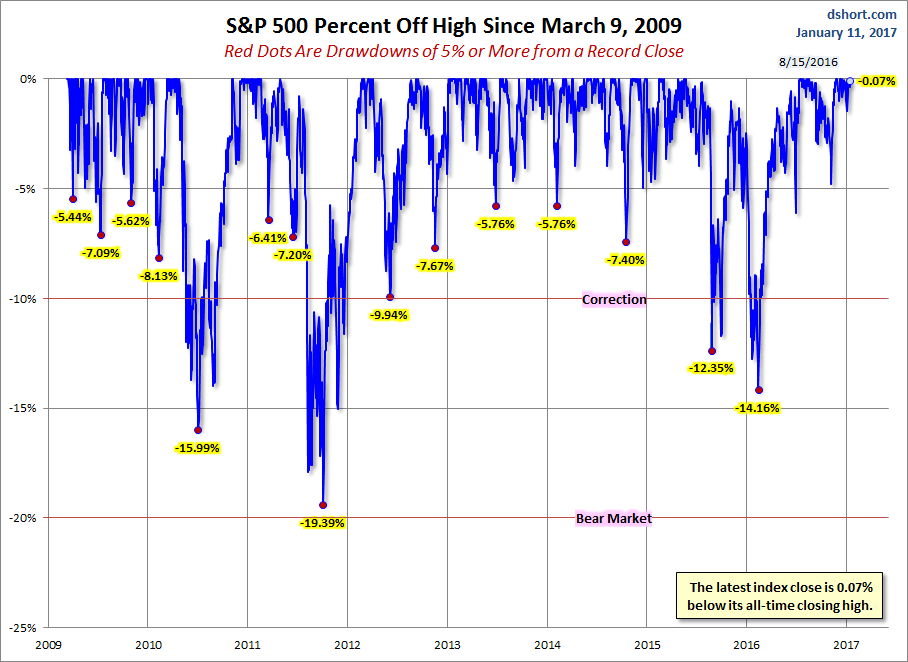
S&P 500 Drawdowns

Here is a more conventional log-scale chart with drawdowns highlighted.
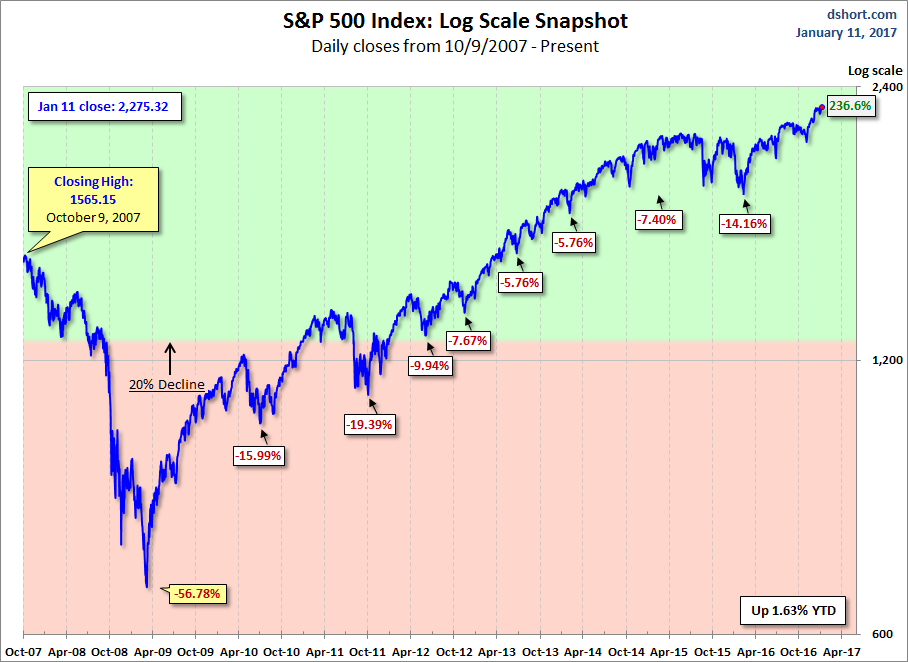
S&P 500 Log Scale Snapshot

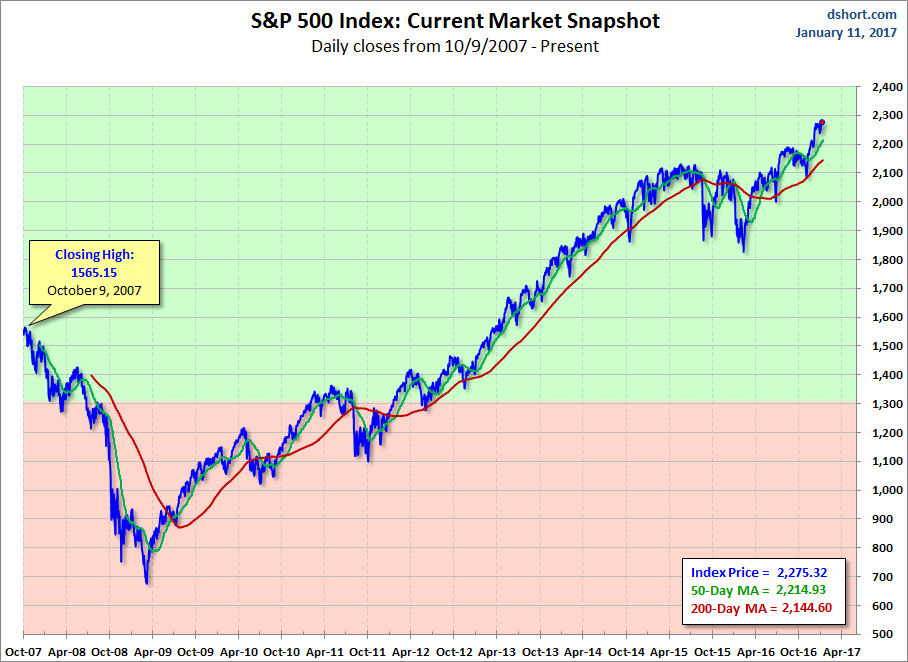
Here is a linear scale version of the same chart with the 50- and 200-day moving averages.
3rd party Ad. Not an offer or recommendation by Investing.com. See disclosure here or remove ads .

S&P 500 Current Market Snapshot

A Perspective on Volatility

For a sense of the correlation between the closing price and intraday volatility, the chart below overlays the S&P 500 since 2007 with the intraday price range. We've also included a 20-day moving average to help identify trends in volatility.
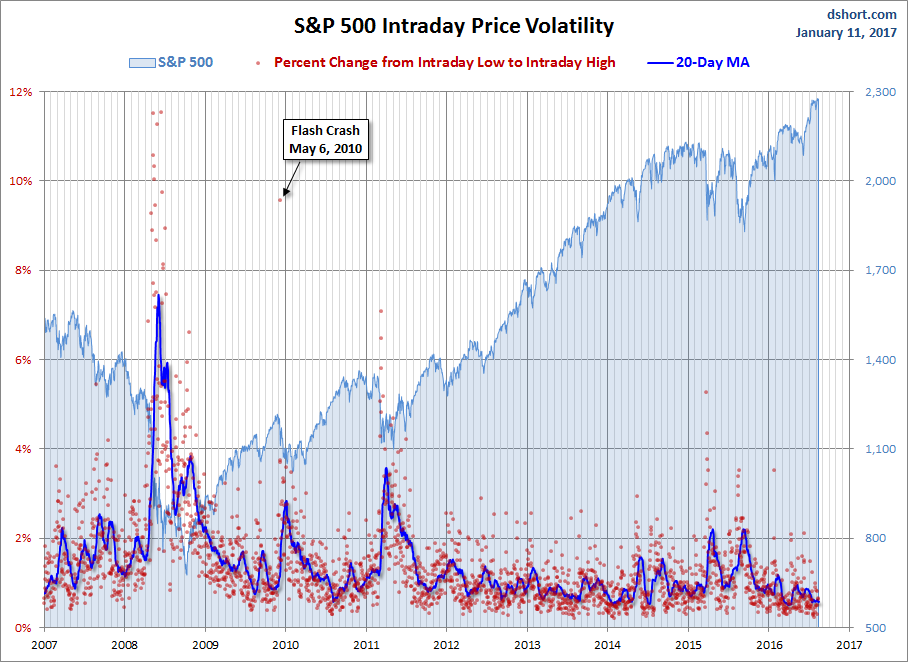
S&P 500 Intraday Price Volatility

Latest comments

Doug, you called movement 0.3 volatile? The onley thing that was volatile was the Vix by itself, by the way what does that mean when the vix fluctuate so much?
Risk Disclosure: Trading in financial instruments and/or cryptocurrencies involves high risks including the risk of losing some, or all, of your investment amount, and may not be suitable for all investors. Prices of cryptocurrencies are extremely volatile and may be affected by external factors such as financial, regulatory or political events. Trading on margin increases the financial risks.
Before deciding to trade in financial instrument or cryptocurrencies you should be fully informed of the risks and costs associated with trading the financial markets, carefully consider your investment objectives, level of experience, and risk appetite, and seek professional advice where needed.
Fusion Media would like to remind you that the data contained in this website is not necessarily real-time nor accurate. The data and prices on the website are not necessarily provided by any market or exchange, but may be provided by market makers, and so prices may not be accurate and may differ from the actual price at any given market, meaning prices are indicative and not appropriate for trading purposes. Fusion Media and any provider of the data contained in this website will not accept liability for any loss or damage as a result of your trading, or your reliance on the information contained within this website.
It is prohibited to use, store, reproduce, display, modify, transmit or distribute the data contained in this website without the explicit prior written permission of Fusion Media and/or the data provider. All intellectual property rights are reserved by the providers and/or the exchange providing the data contained in this website.
Fusion Media may be compensated by the advertisers that appear on the website, based on your interaction with the advertisements or advertisers.
© 2007-2024 - Fusion Media Limited. All Rights Reserved.