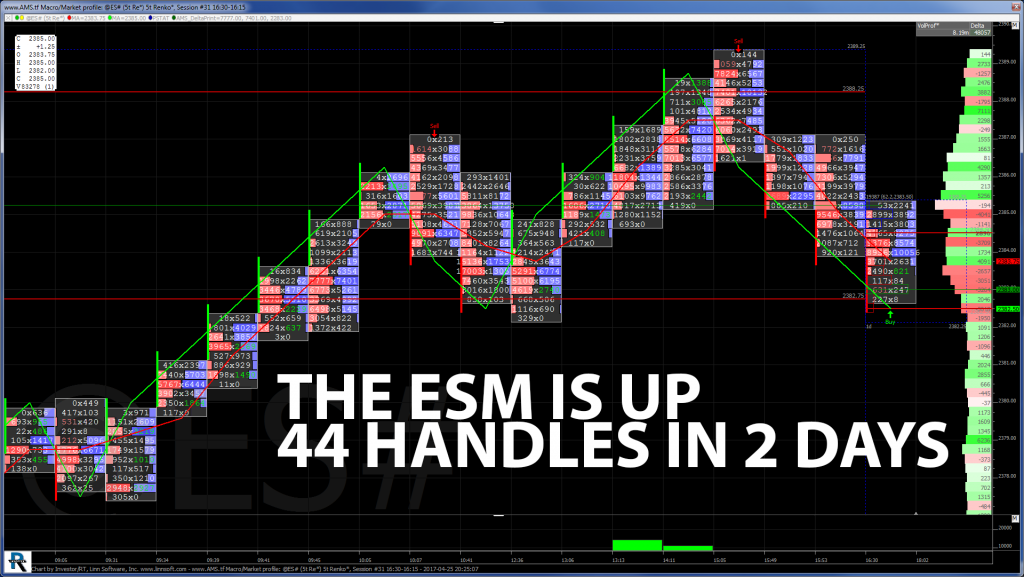
When it comes to the S&P 500 futures (ESM17:CME), there are times when there is a lot to talk about, and then there’s not. Yesterday was most definitely the latter. After a two day 1.9% rally, things started out slow, and then they ended slow. I generally have a lot to say about the days ups and downs, but yesterday was a lot more up than down. The ES traded all the way up to 2369.25 then sold off a little on the close. The main thing about yesterday trade was again the lack of trading volume.
The big news that everyone was talking about was the Nasdaq Composite topping 6000. Yesterday’s surge in technology stocks outperformed all the other indices. It was during the dot.com bubble back in 2000 that the tech laden Nasdaq traded above 5000. As of yesterday’s close, the broader S&P 500 is up +6.7% on the year, while technology stocks in the S&P are up 14%, and the Nasdaq Composite is up 12%.
According to the Wall Street Journal:
- It took the Nasdaq 46 years to close above 6000 since its inception in 1971. In comparison, it took the Dow Jones Industrial Average just over 100 years to first close above 6000, from May 26, 1896 to Oct. 14, 1996.
- The Nasdaq Composite took 4,308 trading days between the fifth and sixth 1000 point milestones, the longest 1000 point run since the very first close above 1000 from inception (6,171 trading days).
- Besides the very first close above 1000, the DJIA has never had a 1000-point run take longer than 3,573 trading days, compared with the Nasdaq’s 4,308 trading days between 5000 and 6000 points.
- It took the DJIA 6,043 trading days between 1000 and 6000 point milestones, while it took the Nasdaq Composite Index 5,482 trading days. In comparison, it took the DJIA 5,129 trading days to go from 6000 to the recent 21000 point milestones.
- Adjusted for inflation, the Nasdaq Composite is still off 1171.07 points from its March 2000 peak, which is 7196.56 in March 2017 dollars.
Yesterday, after a bid going into the open, the S&P 500 futures opened the 8:30 am cst cash session at 2378.50, up 8.25 handles. From there the ESM made a low at 2377.50 before rallying up to 2387.00 just after 9:00 am cst, two ticks from a perfect 10 handle rule, and then retraced back to 2382.50 just before noon. The rally continued going into the final part of the trading day, as the futures pushed up to a new high at 2389.25, up 19 handles at that point. The futures fell back down to 2383.25 going into the closing minutes and settled the day at 2385.00, up 14.75 handles, on an MOC that was absolutely flat.
While You Were Sleeping

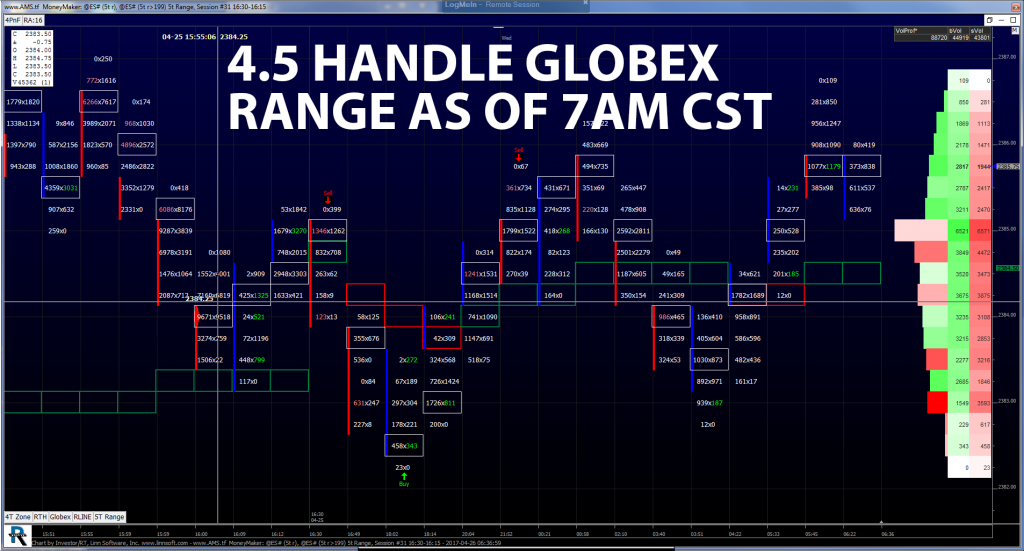
Overnight, Asian markets continued their move higher as all eleven indexes we track closed higher. However, Europe followed with a very mixed and choppy market, with most majors very near unchanged, but with a slight bias to the down side. In the U.S., the S&P 500 futures opened the globex session as 2383 and printed the early low of 2382.25 before trading sideways for much of the session. The futures did get a bump up to 2386.75 on the Euro open, completing a 4.50 handle range. As of 6:45 am cst, the last print is 2384.00, down 1 handle, with just over 100k contracts traded.
In Asia, 11 out of 11 markets closed higher (Nikkei +1.10%), and in Europe 7 out of 12 markets are trading lower this morning (CAC +0.05%). Today’s economic calendar includes Bank Reserve Settlement, MBA Mortgage Applications, EIA Petroleum Status Report, a 2-Yr FRN Note Auction, and a 5-Yr Note Auction.
Our View: #ES2390
I talk a lot about event driven trading, and today’s event is the U.S. carrier strike force that will be approaching the Korean Peninsula. Later in the week it’s going to be the government budget ‘showdown’, and then the French Presidential election “run off” on May 7th. So far, companies in the S&P have reported solid earnings, pushing back on the idea that valuations are too high. Also helping push stocks higher is the Trump administration unveiling its tax plan, which could be as soon as today. This morning we have a light economic calendar, and a big round of earnings reports before and after the bell.
The S&P has rallied 44 handles in two days. I said late Monday on Periscope that there was a good possibility the ES could trade as high as 2390.00, and yesterday 2389.25 was the high, just 3 ticks away. One side of me says you have to be careful because the ES is up against some big resistance, but the other side of me says that with volume so low and earnings so strong, it could be a quick push to new all time highs.
There are a ton of stops building up above 2390.00 and 2396.00 that go all the way up to 2412.00. Our view is to sell the early rallies and buy weakness, knowing that the ES is up so much in two days. We also have a trading rule that says the ‘ES tends to go sideways to down after a big push up’.


