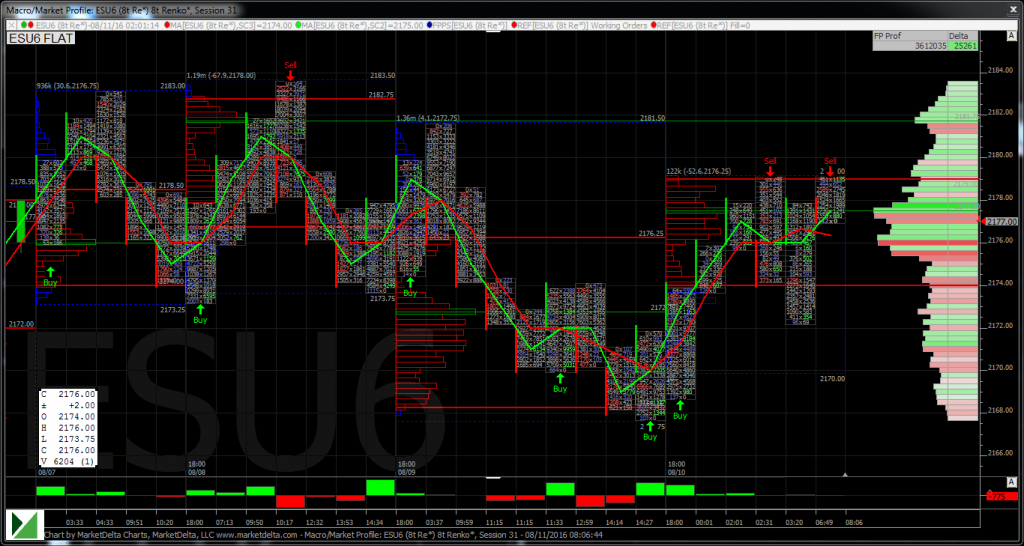
Yesterday was more of the same for the benchmark equity index futures. The S&P 500 futures saw Globex strength and made a lower high above 2180 at 2181.50. After a drop going into the cash open, RTH buyers were never able to recapture the 2180 price, and then the sell programs arrived.
Sellers pushed the ESU lower through the 2175-2172 support area, all the way back to Friday’s cash open, thus retracing the NFP gains. However, the index did rally from there to close the session at 2172.75, right back into the support range.
An overnight rally pushed the ES to a 2179 high early in the euro session before trading back down to 2172.25, and has now rallied again trading at 2177.75, up 5 handles on the session, and just 5 ticks from the overnight high. Total volume has been about the same hitting 100k at 6:00 am cst.
Yesterday shows another example of how volume increases as equities sell. We have seen volume trend from sub 1 million on Monday, to 1.1 million on Tuesday, and now 1.3 million on Wednesday.
New all time contract highs during Globex on low volume days, then higher volume on the retracements are not a good sign, but it’s the market we trade. Yesterday’s 12.25 handle range was the largest of the week, and even seemed great when compared to the sub 10 handle ranges in recent sessions.
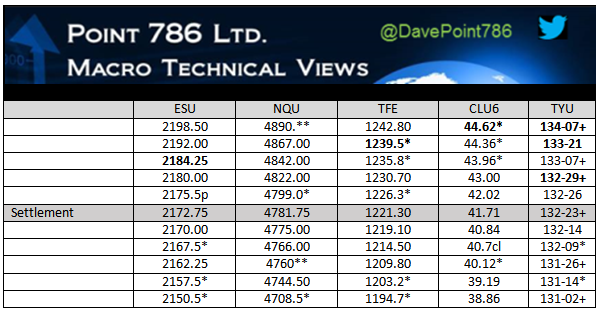
Today’s calendar likely does not have anything that will be market moving, and while Asia traded mostly weaker, Europe again is lifting the markets trading higher. Today we will be watching that 2180 area to the upside, which has now become a ceiling for this market, and has failed three times.
It looks a little more fuzzy now on the downside. The 2172 area is projected to be support, but this floor let the market down yesterday. Bulls need a rally to close above 2180 while bears need to start with selling to push a close below 2170.
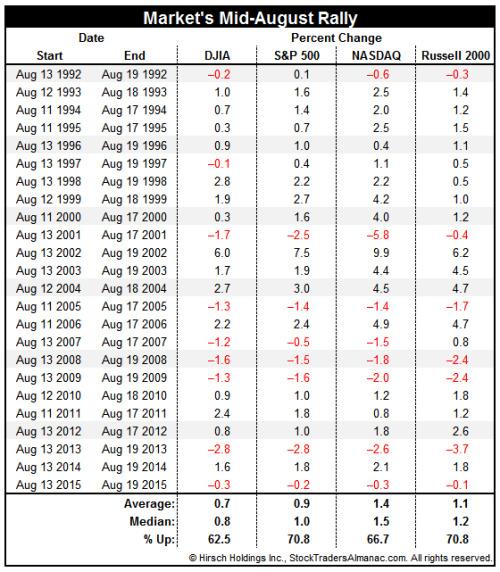
70.8% Chance of a Mid-August Rally
Courtesy of Stock Traders Almanac:

In election years the full month of August tends to perform much better than in other years. Instead of lingering near the bottom of the performance standings, August sits near or at the top in election years.
Within the month of August, strength has been most consistent on the 10th, 11th, 12th and 13th trading days over the past 24 years. S&P 500 and Russell 2000 have advanced over this four-consecutive day span 70.8% of the time with average gains of 0.9% and 1.1% respectively. DJIA and NASDAQ have not risen as frequently, but still maintain solid average gains of 0.7% and 1.4%.
Part of the explanation for this strength can be traced to typical monthly cash inflows around the 15th and some of it is likely due to early month weakness setting up a rebound rally.
This year the rally begins on the close of August 11 and lasts until the close on August 17. Four of the last six mid-August rallies in election years have been respectable. In 2008 the four-day span was negative across the board and in 1992 on S&P 500 advanced.
More Of The Same
In Asia, 6 out of 11 markets closed lower (Shanghai -0.53%), and in Europe 10 out of 12 markets are trading higher this morning (DAX +0.75%). Today’s economic calendar includes the Weekly Bill Settlement, Jobless Claims, Import and Export Prices, Bloomberg Consumer Comfort Index, EIA Natural Gas Report, a 3-Month Bill Announcement, a 6-Month Bill Announcement, a 52-Week Bill Announcement, a 5-Yr TIPS Announcement, a 30-Yr Bond Auction, Fed Balance Sheet and Money Supply.

Our view: In this tight range we have been calling to buy the early weakness and sell strength. That remains our call as we continue to fade the edges of the 2170 and 2180 area. At this point, it looks like yesterday’s selling was just noise for dip buying, similar to Tuesday of last week.
Late week has been the strength of the S&P as of late, and the best chance of closing above the 2180 price at new all time highs will be today or tomorrow. However, a fourth failure of 2180 this week, and the door opens to a pullback larger than the 10 handles we saw yesterday.
