
Ryder System Inc. (NYSE:R) reported better-than-expected earnings and revenues in the second quarter of 2016. The transportation company’s adjusted earnings per share of $1.56 beat the Zacks Consensus Estimate of $1.54. Earnings declined 5% from the year-ago figure.
Ryder System reported revenues of $1,703.7 million, beating the Zacks Consensus Estimate of $1,686 million. The top line also improved over 2% on a year-over-year basis. Foreign currency movements hurt the top line in the quarter.
Segment Results
Fleet Management Solutions: Total revenue was flat at $1.5 billion in the second quarter of 2016. Meanwhile, operating revenues (revenue excluding fuel) moved up 4% year over year to $995 million.
Supply Chain Solutions: Total revenue came in at $402 million, up 1% from the year-ago quarter. Operating revenues (excluding fuel and subcontracted transportation) grew 4% year over year to $332 million.
Dedicated Transportation Solutions: Total revenue in the quarter under review was $258 million, up 16% year over year. Meanwhile, operating revenues (revenue excluding fuel and subcontracted transportation) increased 10% year over year to $194 million.
RYDER SYS Price, Consensus and EPS Surprise
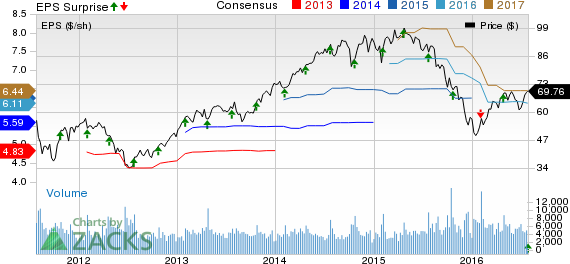
RYDER SYS Price, Consensus and EPS Surprise | RYDER SYS Quote
Liquidity & Capital Expenditure
Ryder System exited the second quarter of 2016 with cash and cash equivalents of $66 million compared with $60.9 million at end-2015. The company had total debts of $5,634 million compared with $5,502.6 million at the end of 2015.
The company generated operating cash of $763 million in the first nine months of 2016 as compared with $659 million at the end of 2015. The company maintains operating cash flow projection at $1.6 billion for 2016. Free cash flow is now projected at $200 million for 2016 as compared with $100 million estimated previously.
Guidance
The company now expects 2016 adjusted earnings in the band of $5.90 to $6.05 per share (old guidance: $6.10 to $6.30). The Zacks Consensus Estimate for 2016 earnings is pegged at $6.11 per share. The company expects third-quarter adjusted earnings per share in the band of $1.65 to $1.72. The Zacks Consensus Estimate for third-quarter earnings stands at $1.74 per share. The disappointing guidance sent shares skidding in early trading despite the earnings beat.
Zacks Rank & Stocks to Consider
Ryder System currently carries a Zacks Rank #4 (Sell). Better-ranked stocks in this sector include Grupo Aeroportuario del Centro Norte, S.A.B. de C.V. (NASDAQ:OMAB) and Grupo Aeroportuario del Pacífico, S.A.B. de C.V. (NYSE:PAC) with a Zacks Rank #1 (Strong Buy) and Matson, Inc. (NYSE:MATX) with a Zacks Rank #2 (Buy).
RYDER SYS (R): Free Stock Analysis Report
GRUPO AEROP-ADS (OMAB): Free Stock Analysis Report
GRUPO AEROP-PAC (PAC): Free Stock Analysis Report
MATSON INC (MATX): Free Stock Analysis Report
Original post
Zacks Investment Research